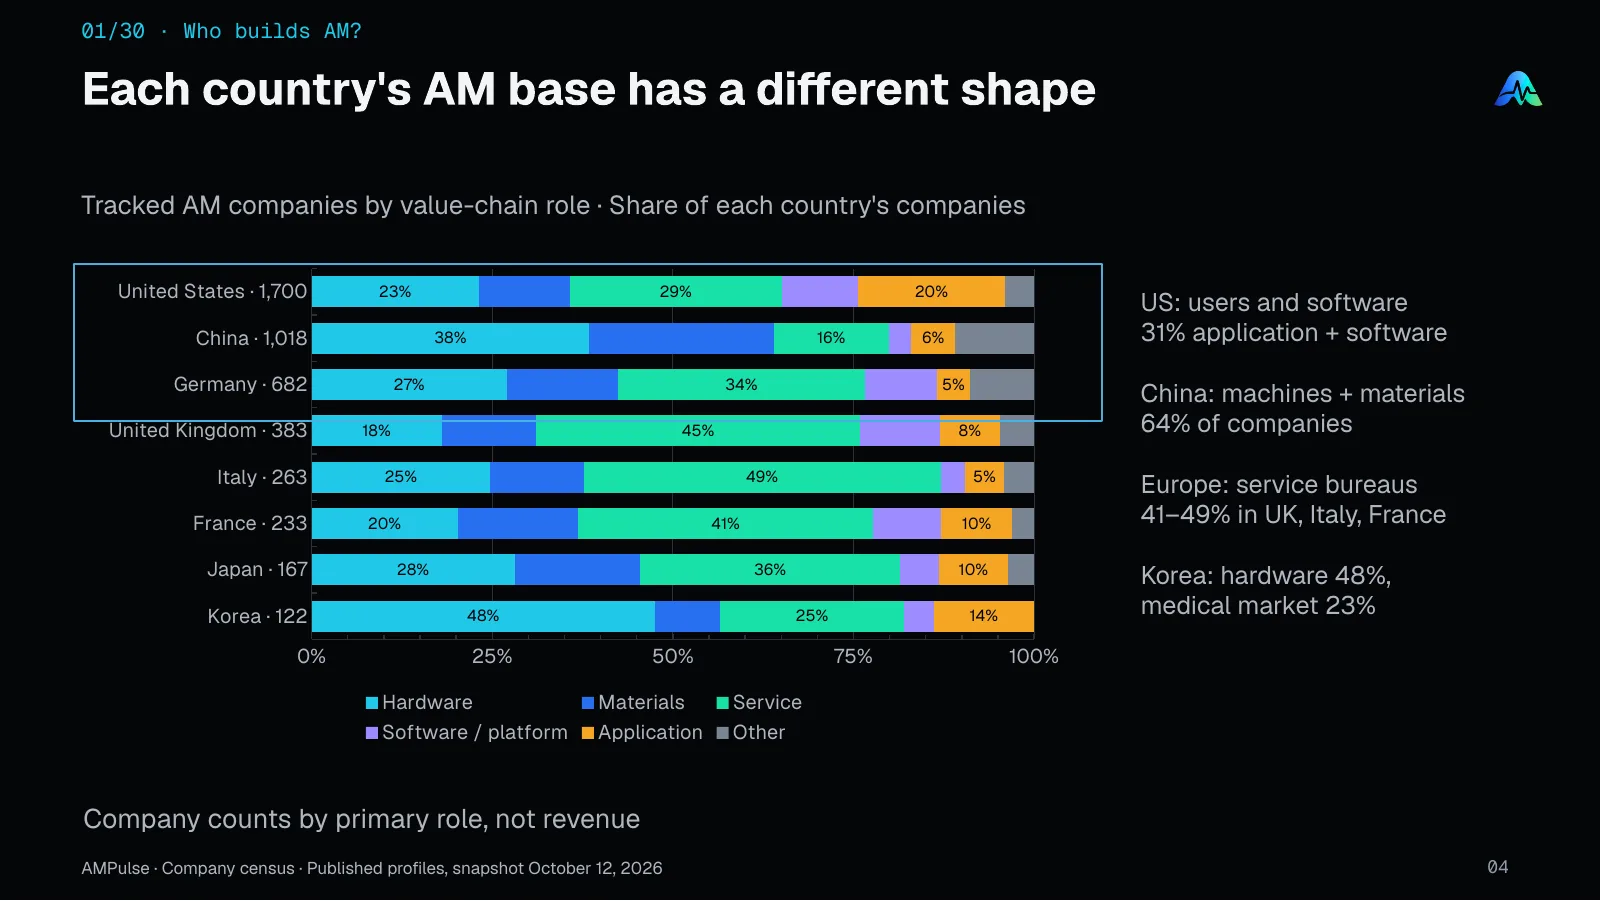
In the US, 31% of tracked companies are users that make their own products with AM or software companies. In China, 64% make machines or materials. Service bureaus lead in Britain, Italy and France at 41–49% of companies, and Korea has the largest hardware share, 48%, with 23% of its firms serving medical markets.
Source & scope
AMPulse · Company census · Published profiles, snapshot October 12, 2026.
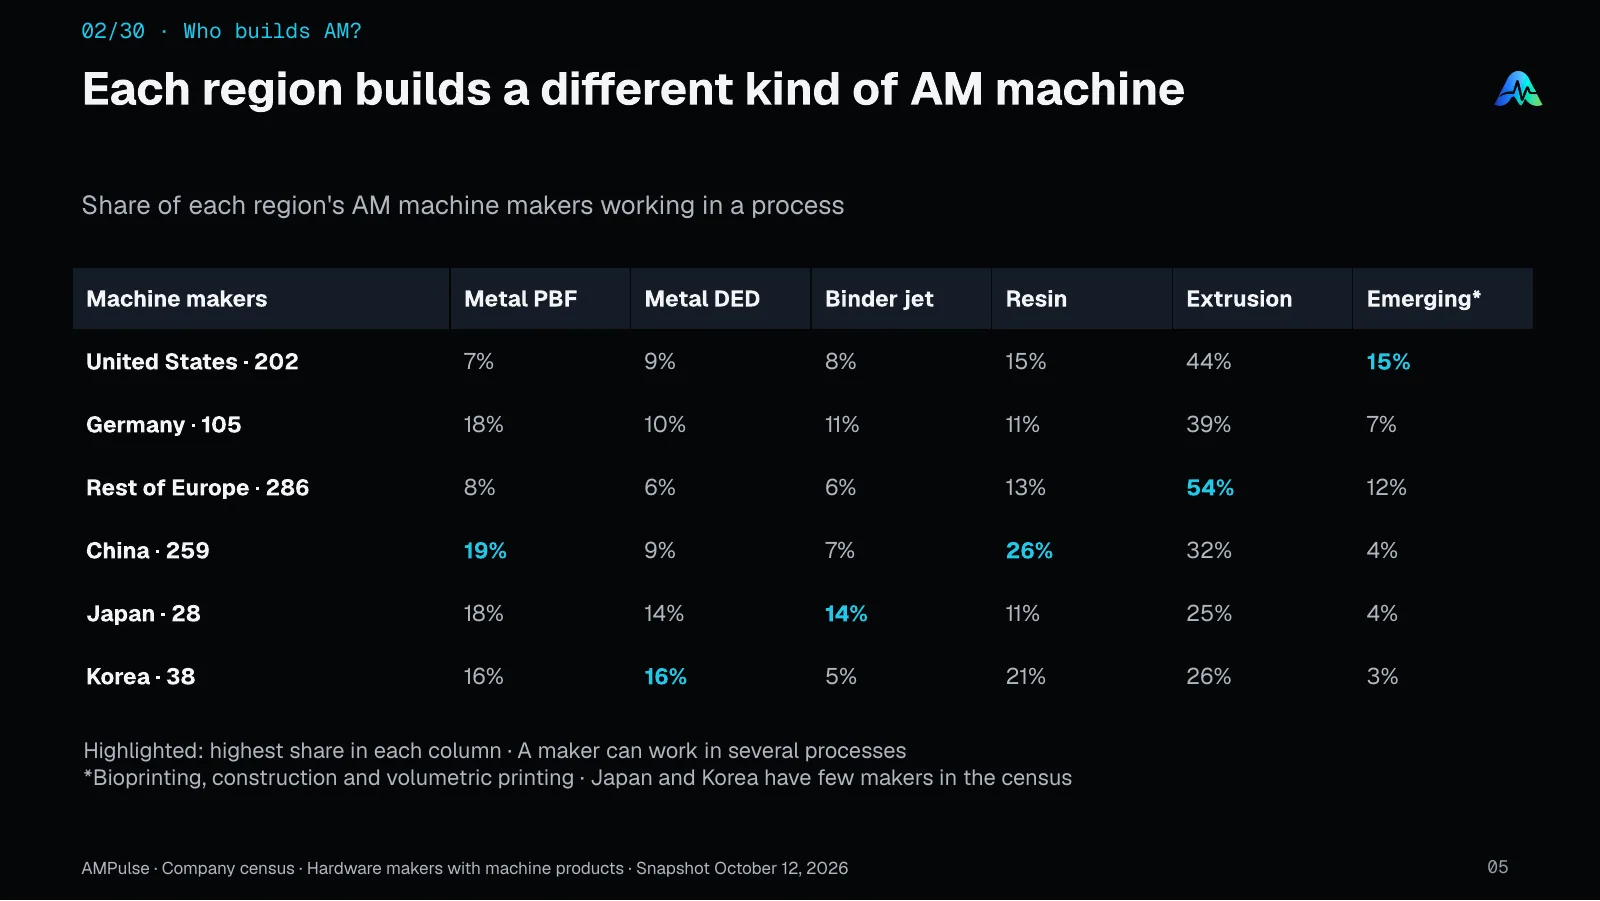
Newer processes such as bioprinting and construction printing are most common among US makers (15%). More than half of the makers in the rest of Europe build extrusion printers (54%). China leads in resin printers (26%) and metal powder bed fusion (19%), Korea and Japan in metal DED (16% and 14%), and Japan also in binder jetting (14%).
Source & scope
AMPulse · Company census · Hardware makers with machine products · Snapshot October 12, 2026.
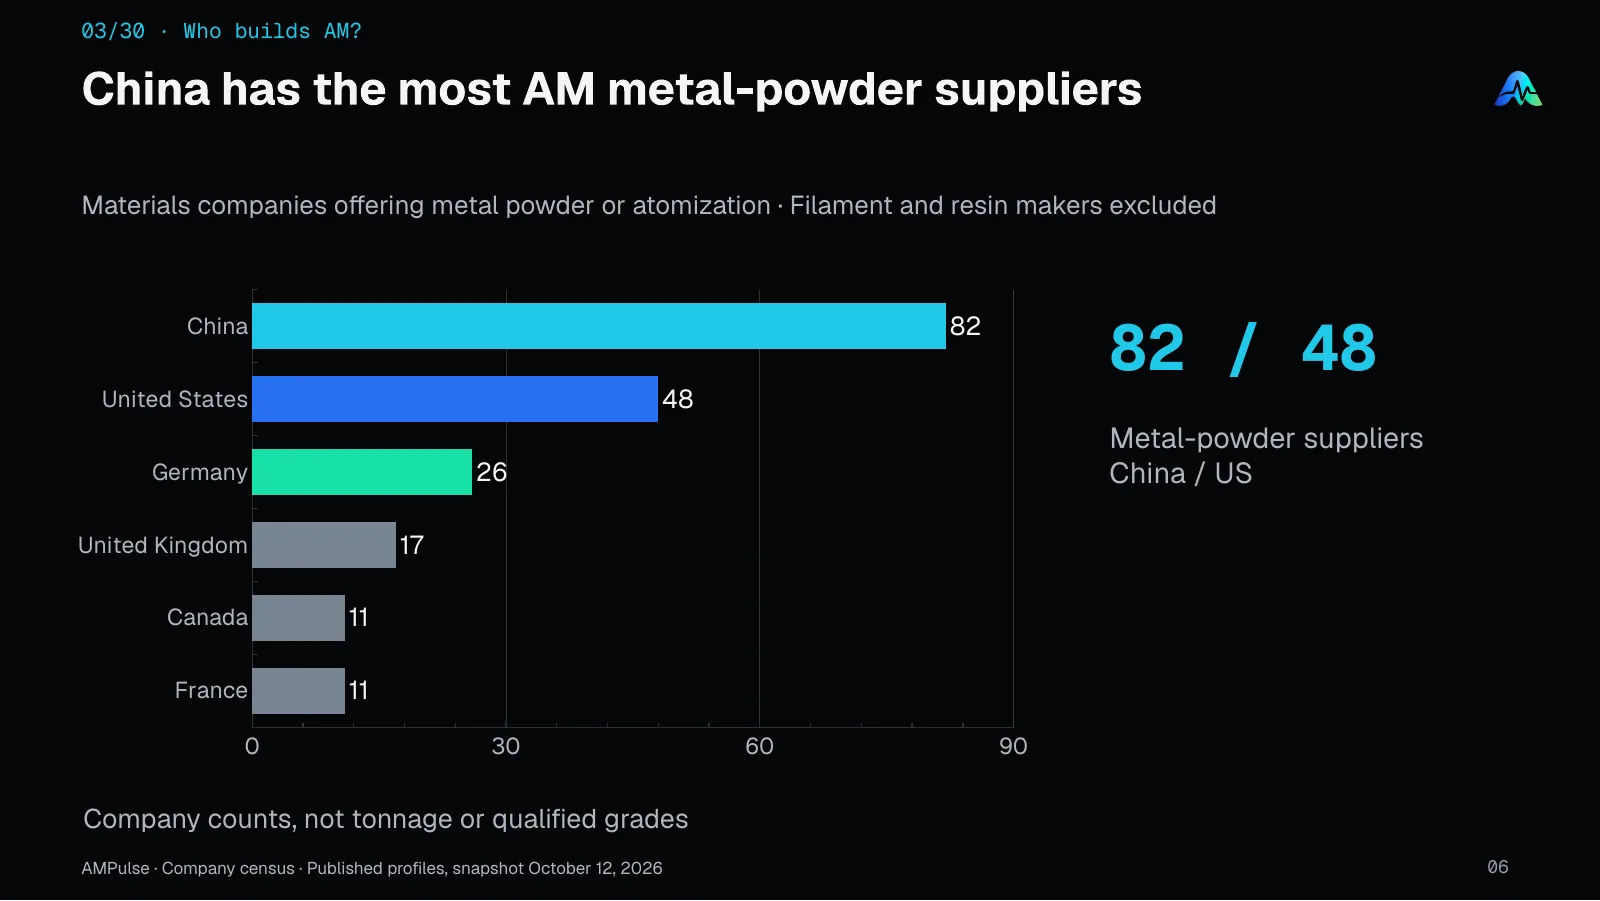
China has 82 tracked suppliers of AM metal powder or atomization, against 48 in the US and 26 in Germany. These are company counts, not tonnage or qualified grades.
Source & scope
AMPulse · Company census · Published profiles, snapshot October 12, 2026.
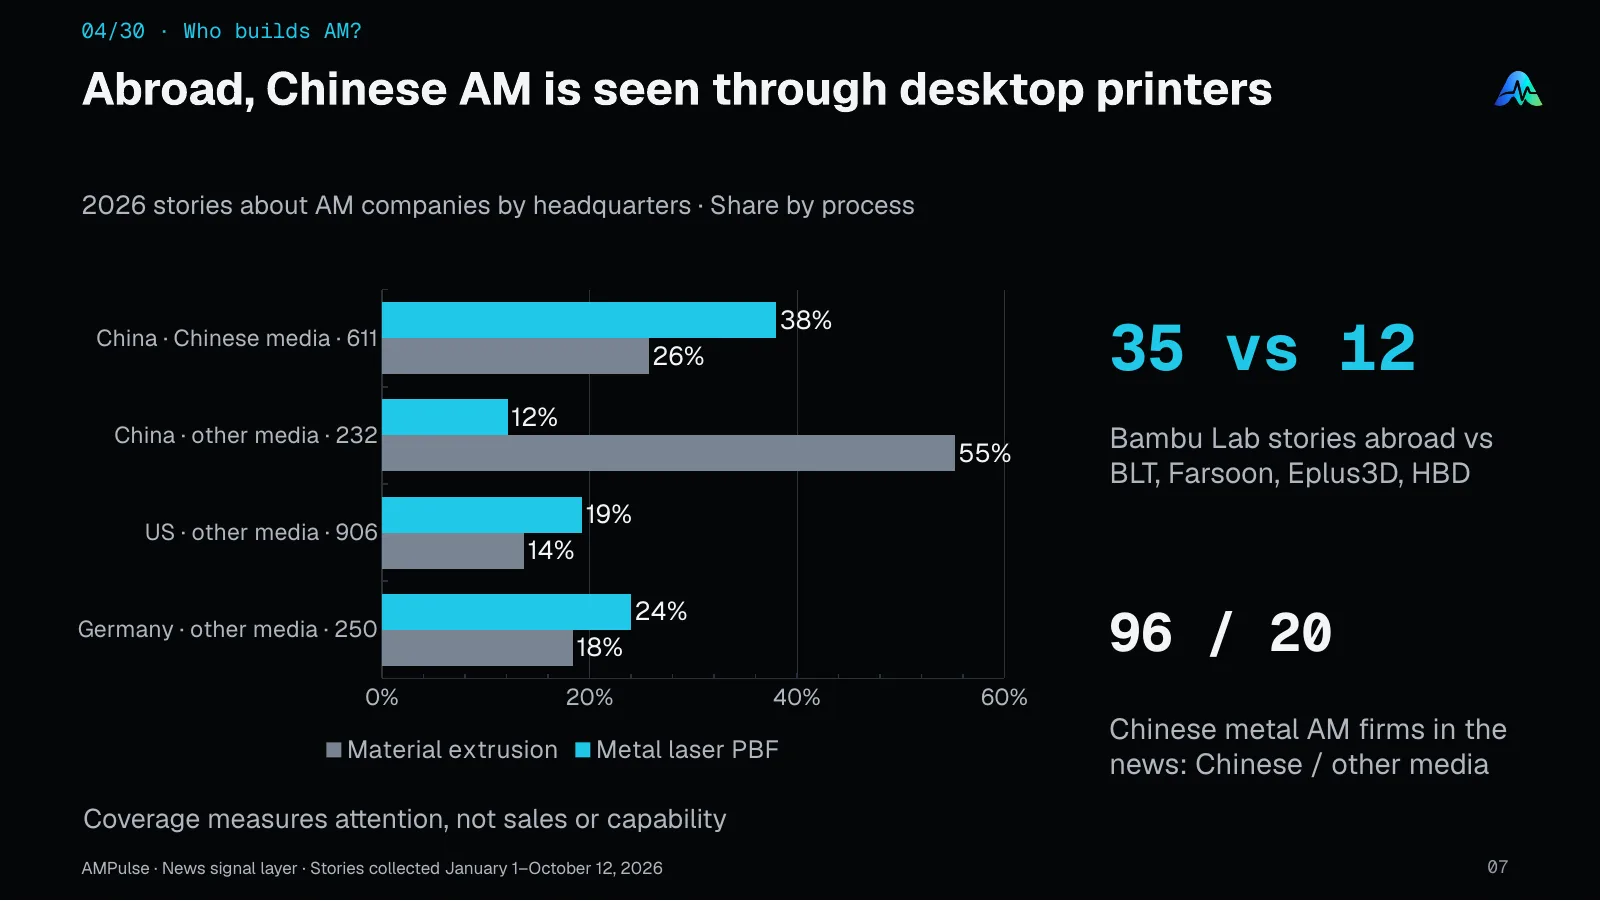
In Chinese-language media, 38% of 2026 stories on Chinese AM companies concern metal laser powder bed fusion and 26% material extrusion. In other media the split reverses: 55% extrusion and 12% metal. Bambu Lab alone drew 35 stories abroad, against 12 for BLT, Farsoon, Eplus3D and HBD combined.
Source & scope
AMPulse · News signal layer · Stories collected January 1–October 12, 2026.
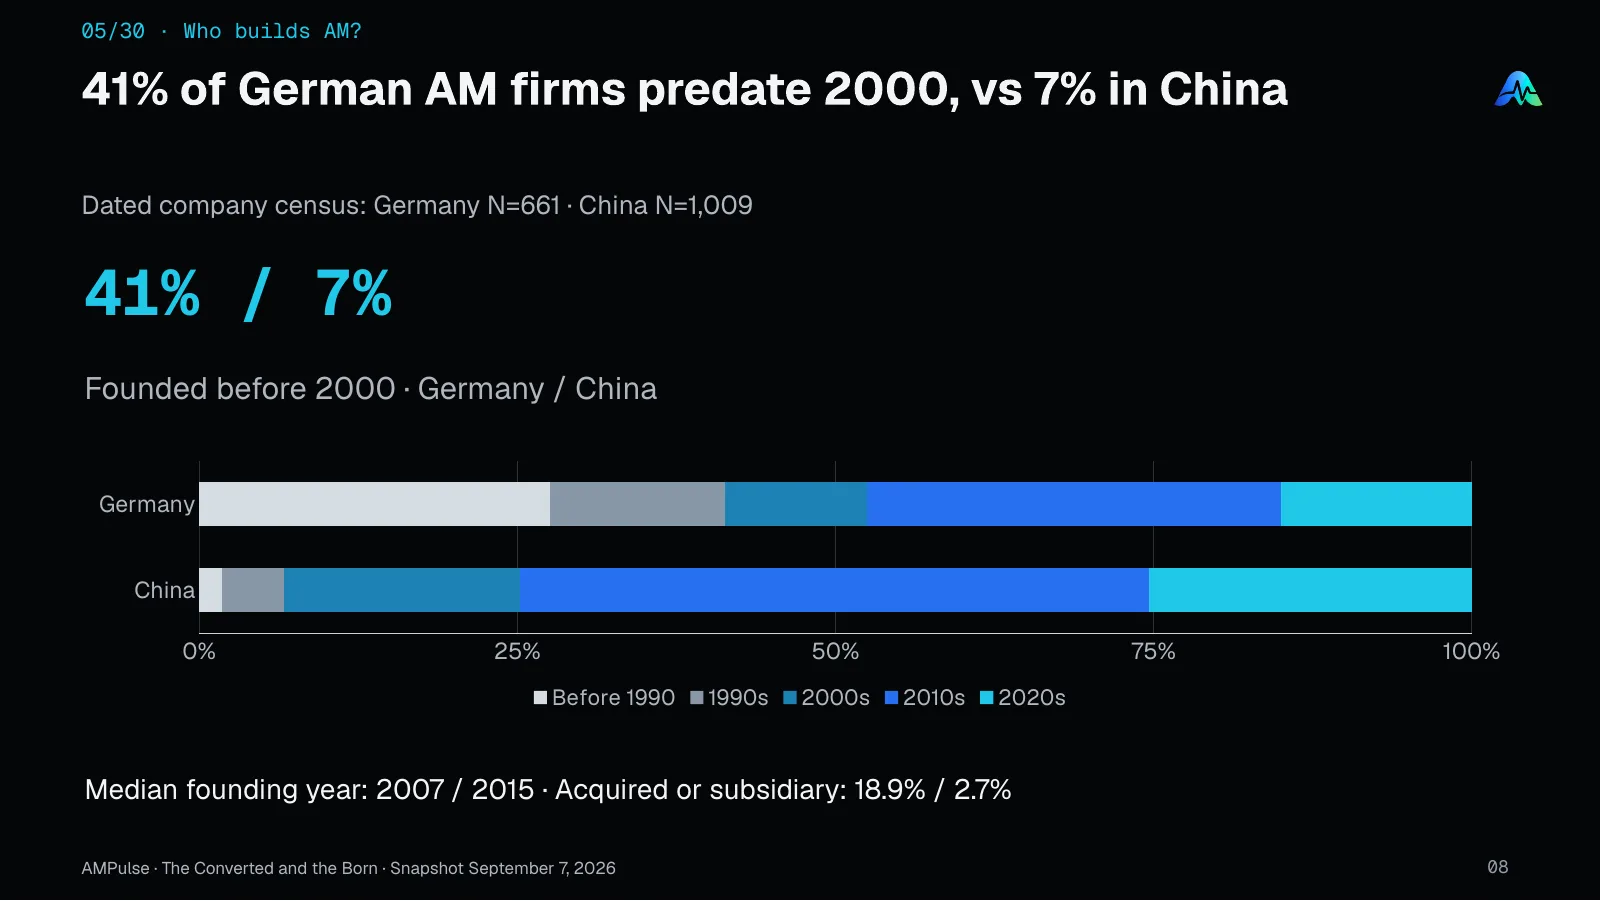
41% of dated German AM companies were founded before 2000, against 7% in China, and the median founding years are 2007 and 2015. 18.9% of German firms are already acquired or subsidiaries, against 2.7% in China. Germany converted an existing industry into AM; China's AM companies were founded for it.
Source & scope
AMPulse · The Converted and the Born · Snapshot September 7, 2026.
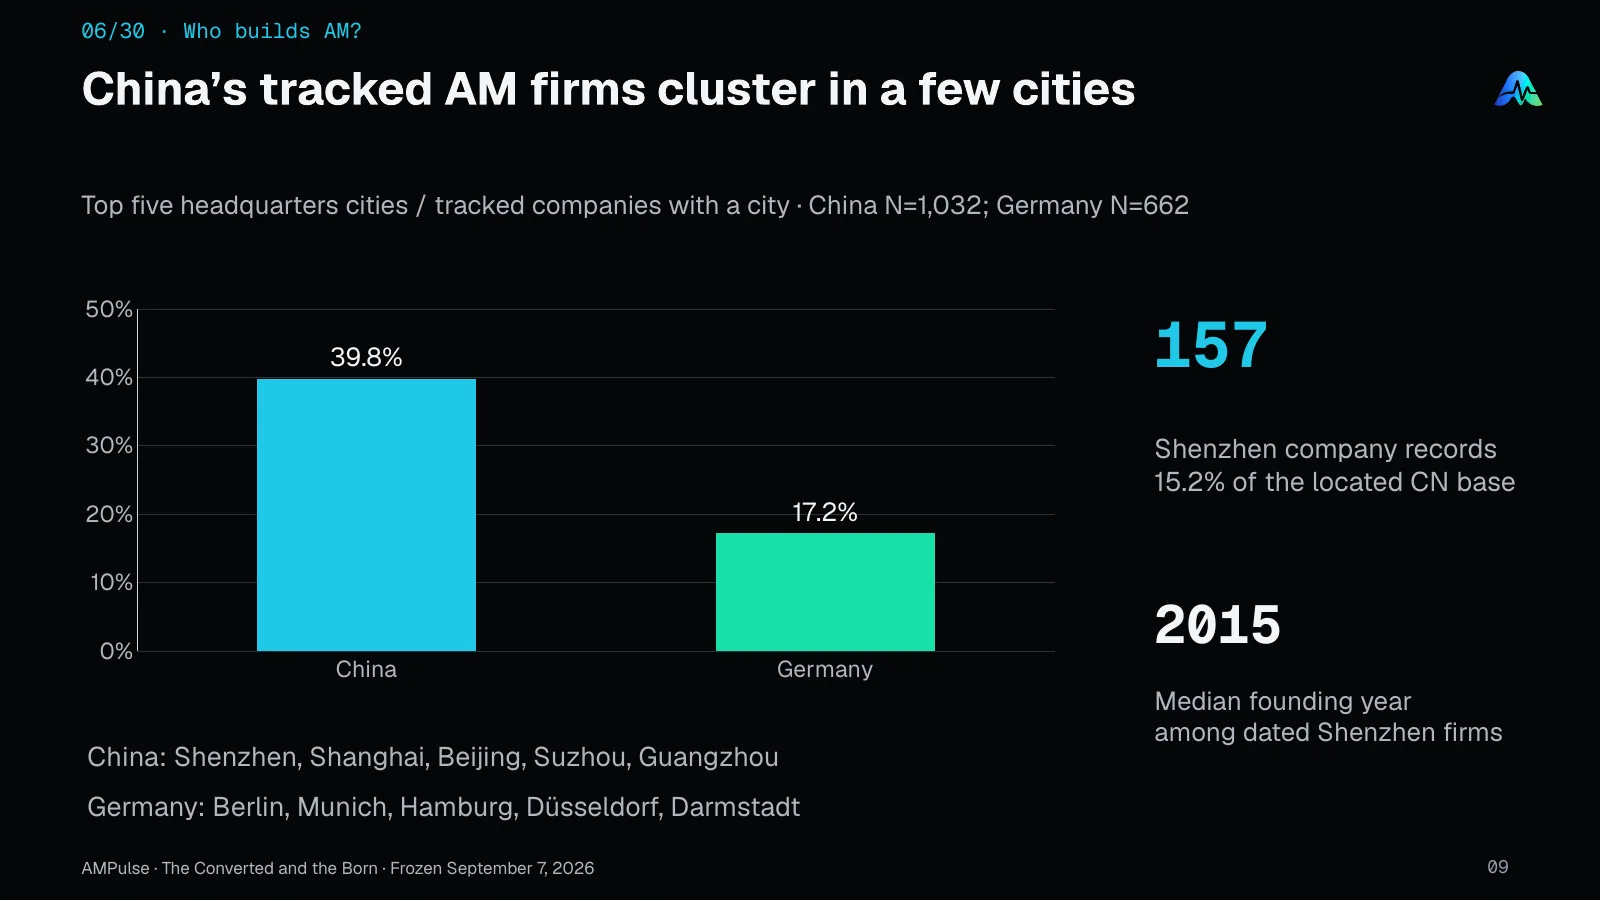
The top five cities hold 40% of Chinese AM companies with a known city, against 17% in Germany. Shenzhen alone has 157 company records, 15% of the located Chinese base, with a median founding year of 2015.
Source & scope
AMPulse · The Converted and the Born · Frozen September 7, 2026.
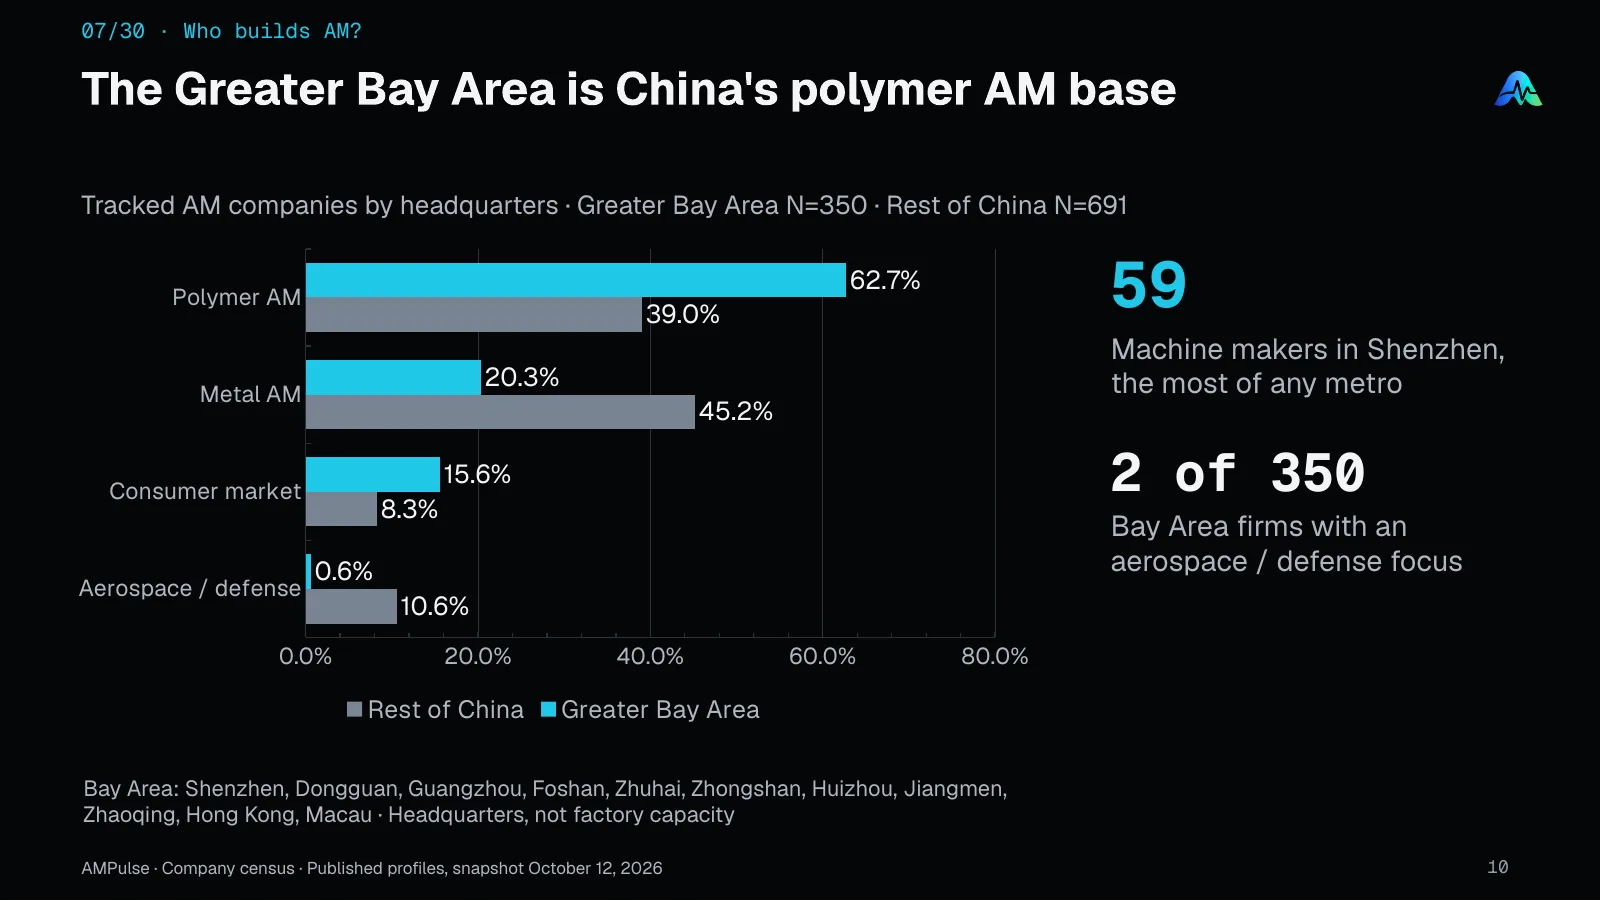
63% of Greater Bay Area AM companies work in polymer, against 39% in the rest of China, and 2 of 350 focus on aerospace or defense. Shenzhen has 59 machine makers, the most of any metro in the census, and is home to Bambu Lab, Creality, Anycubic, ELEGOO and Snapmaker.
Source & scope
AMPulse · Company census · Published profiles, snapshot October 12, 2026.
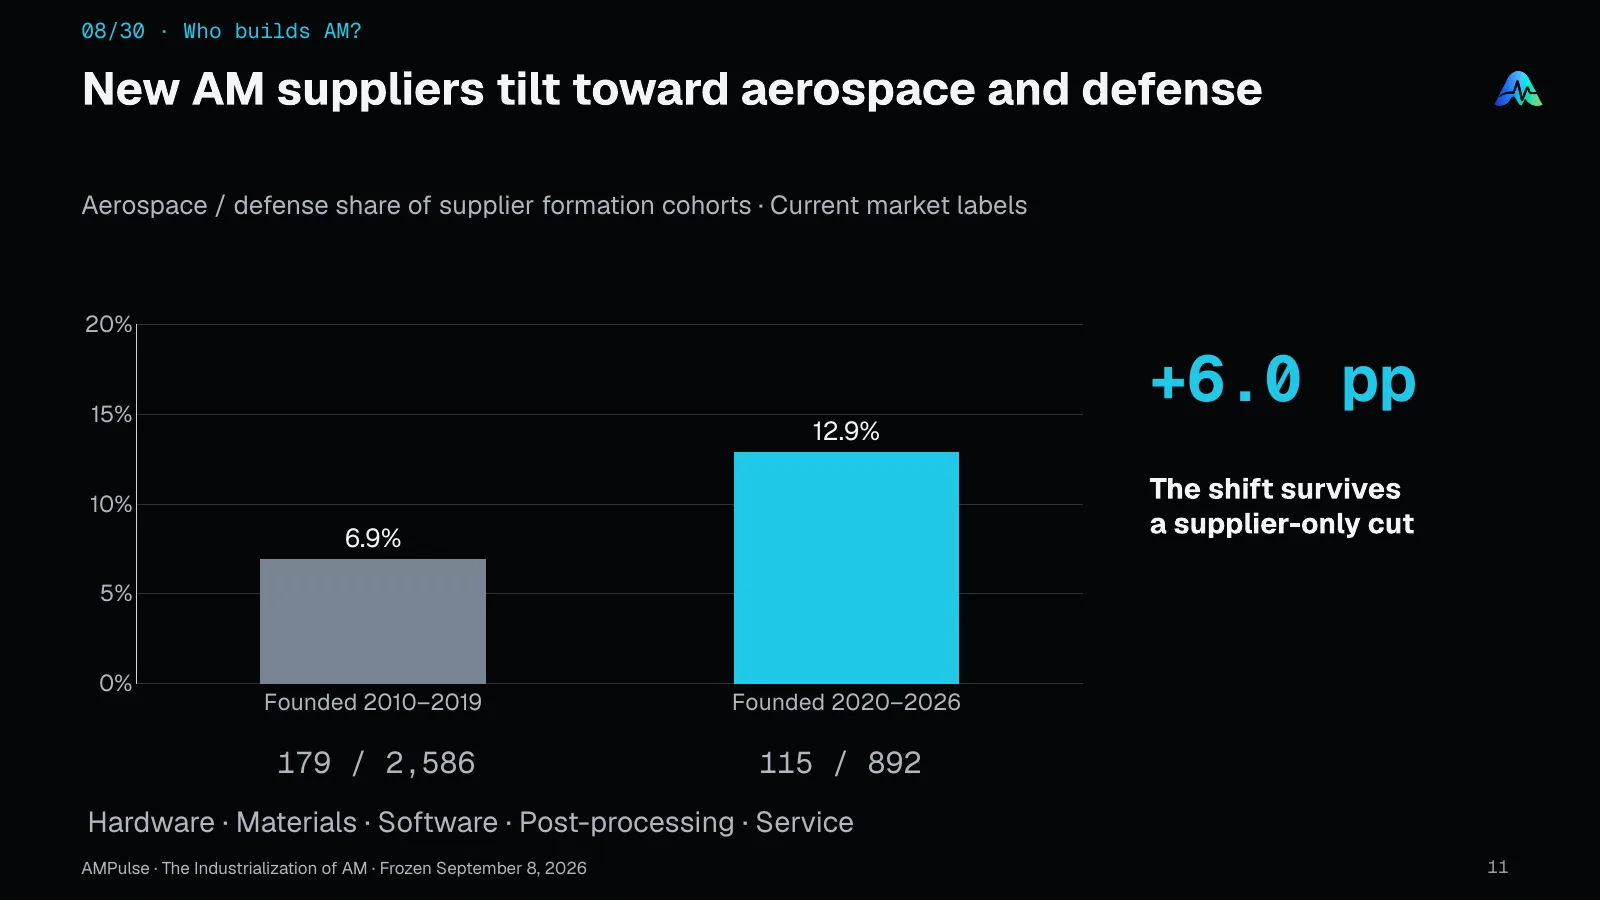
Among AM suppliers founded in the 2010s, 6.9% target aerospace and defense; among those founded since 2020, 12.9%. The 6.0-point shift holds when only hardware, materials, software, post-processing and service suppliers are counted.
Source & scope
AMPulse · The Industrialization of AM · Frozen September 8, 2026.
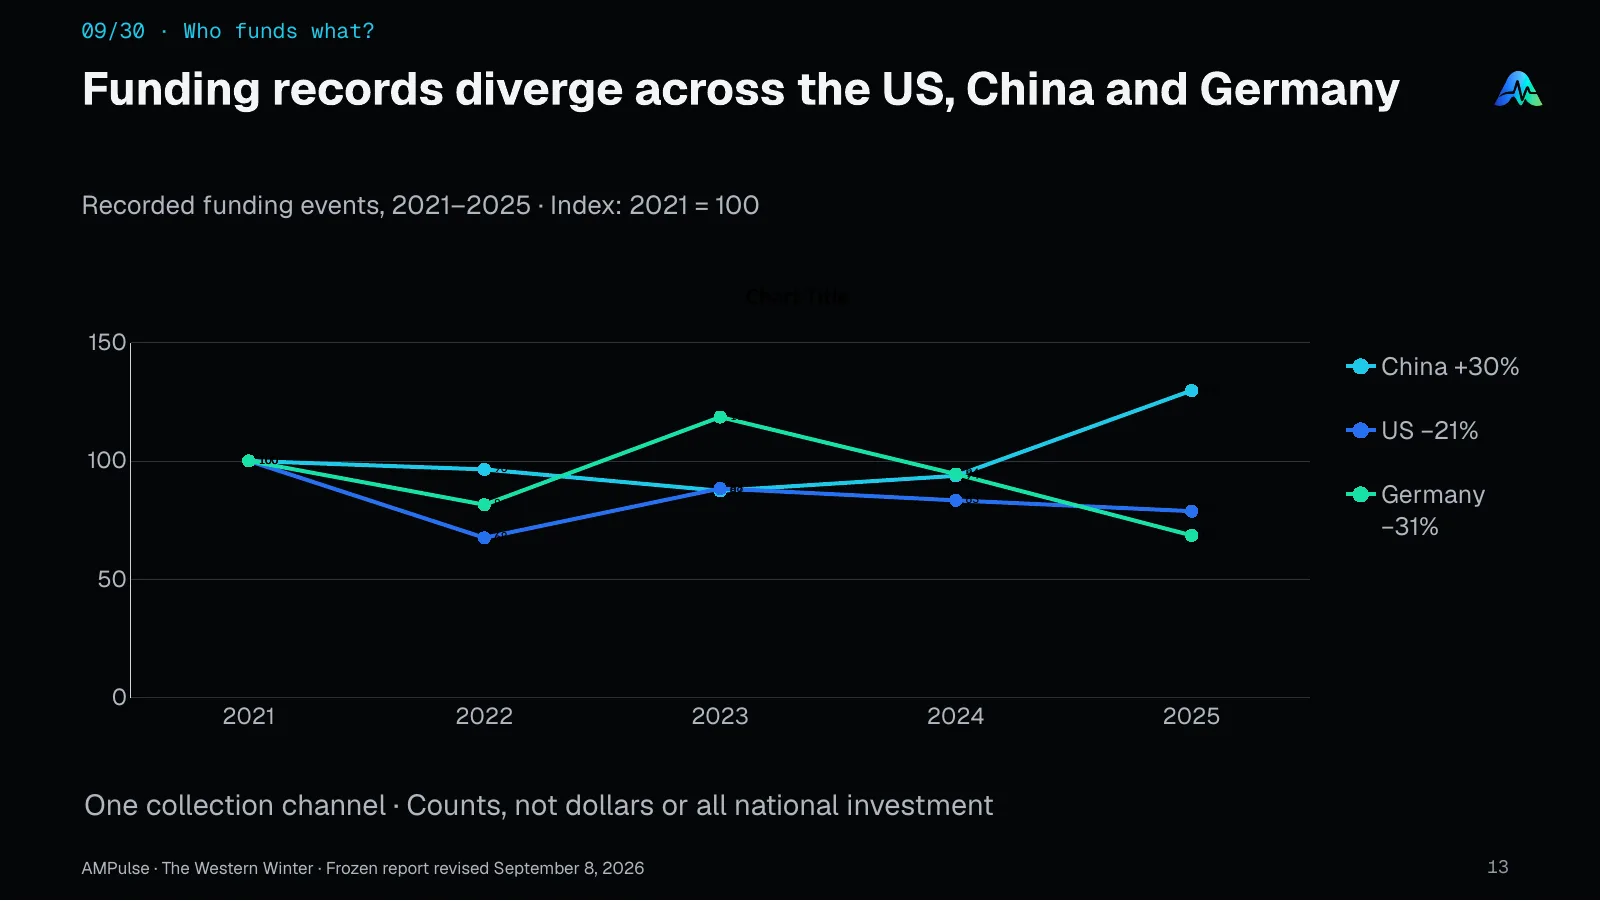
Indexed to each country's 2021 count, recorded AM funding events in 2025 stand 30% higher in China, 21% lower in the US and 31% lower in Germany. The series counts events, not dollars.
Source & scope
AMPulse · The Western Winter · Frozen report revised September 8, 2026.
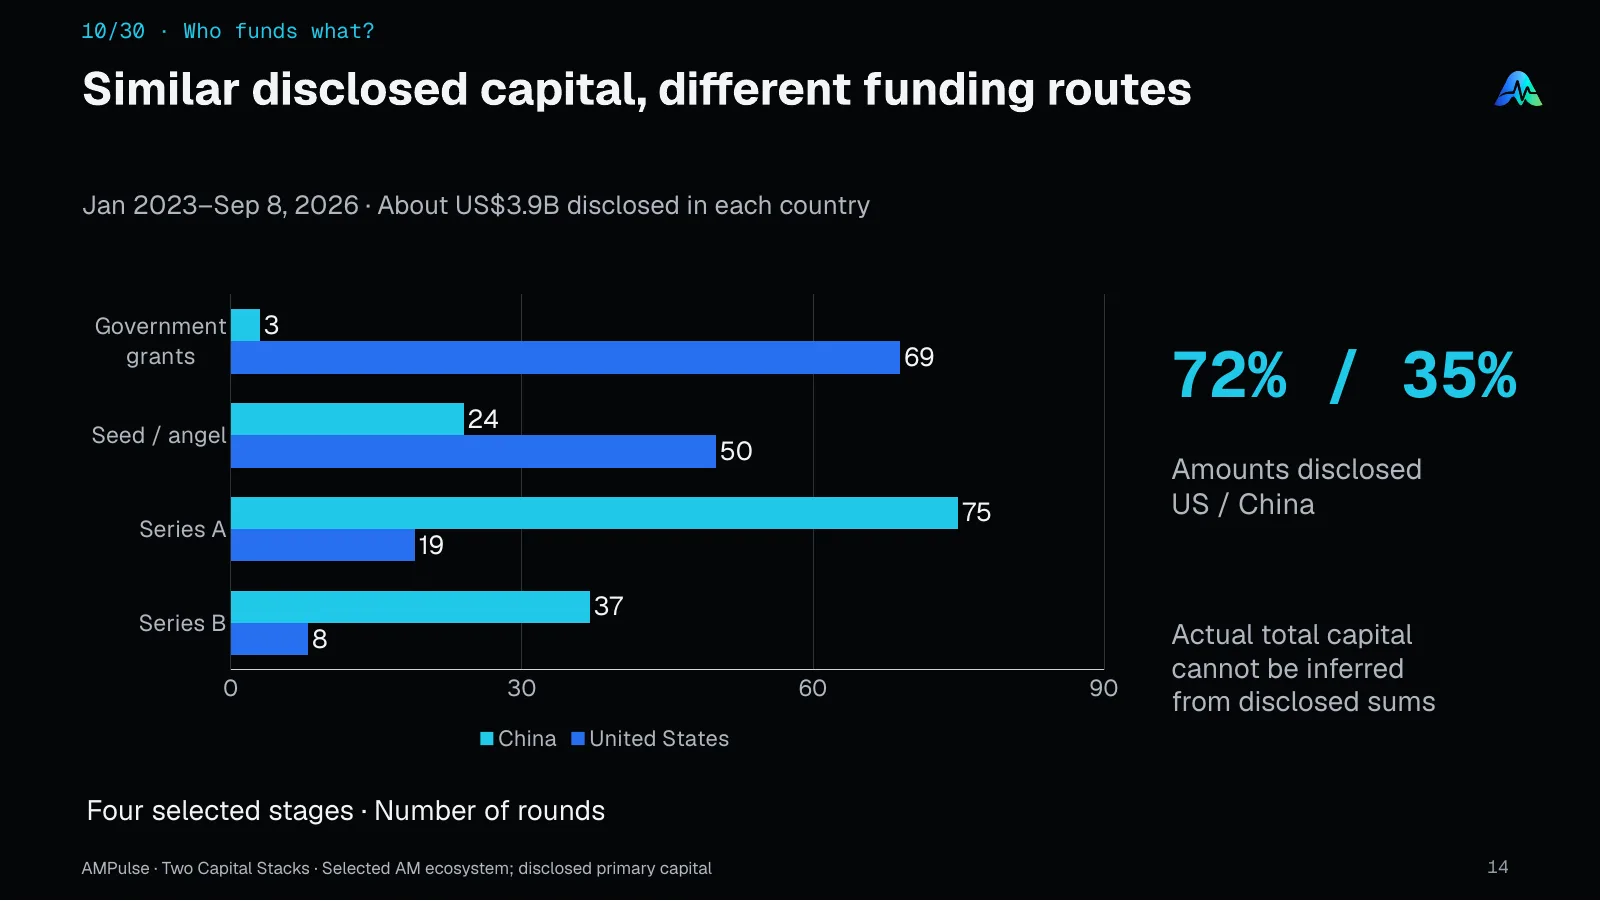
The US and China each show about $3.9 billion of disclosed primary AM capital from January 2023 to September 8, 2026, through opposite routes: the US through government grants (69) and seed rounds, China through Series A (75) and Series B (37) rounds. 72% of US round amounts are disclosed, against 35% in China.
Source & scope
AMPulse · Two Capital Stacks · Selected AM ecosystem; disclosed primary capital.
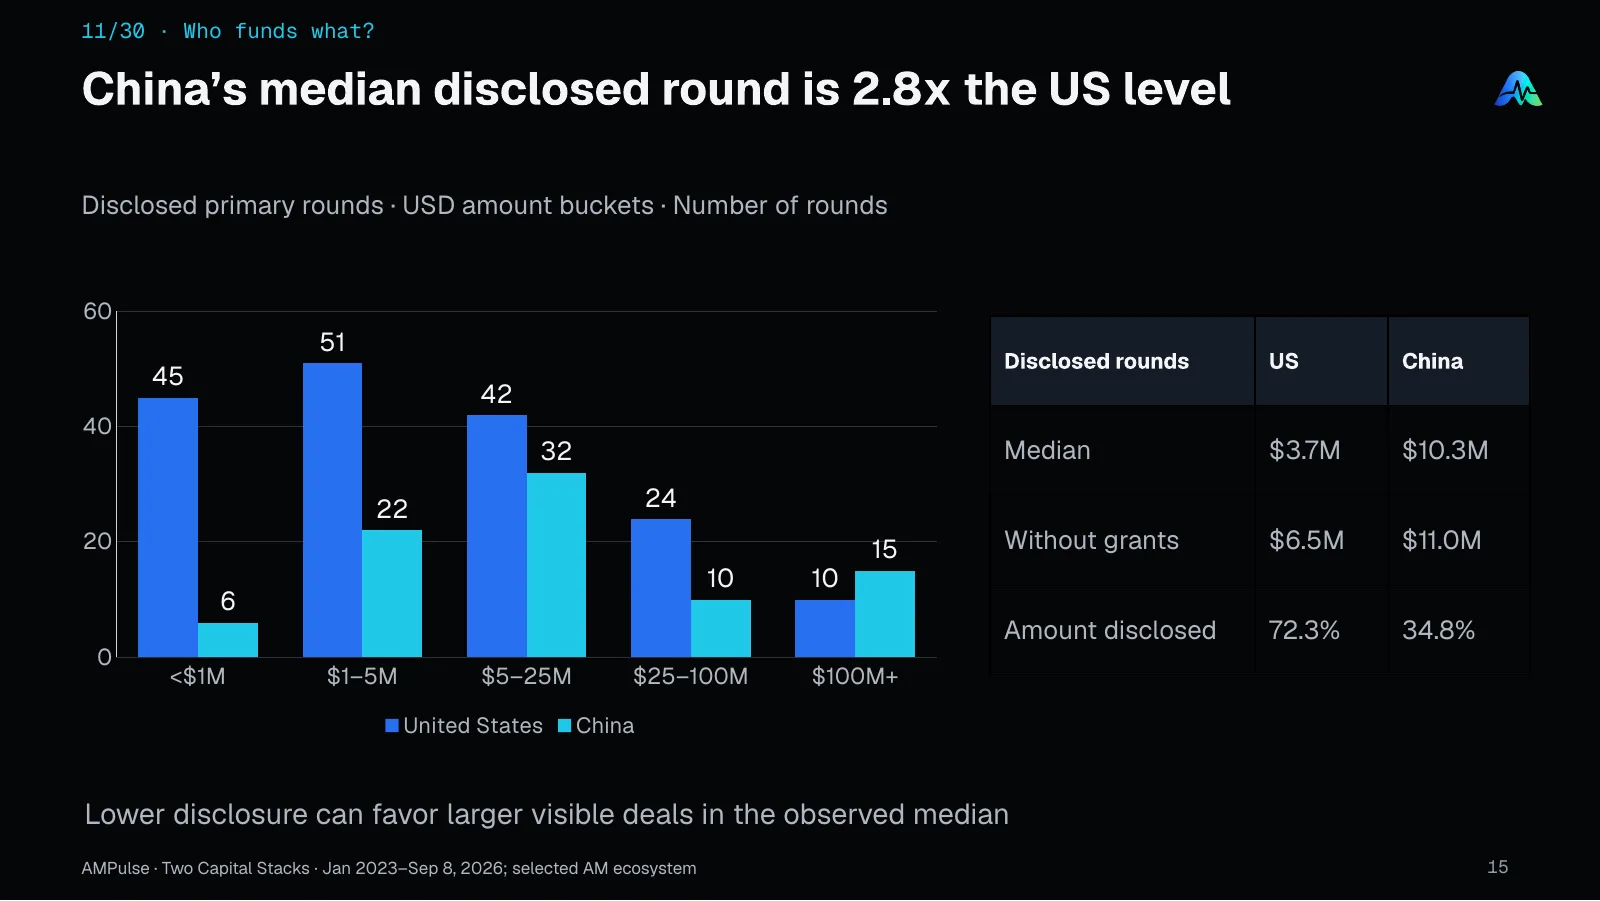
The median disclosed round is $10.3 million in China and $3.7 million in the US, 2.8 times higher; without grants, $11.0 million and $6.5 million. The US has more rounds under $1 million (45 against 6), China more above $100 million (15 against 10). Lower disclosure in China can favor larger visible deals.
Source & scope
AMPulse · Two Capital Stacks · Jan 2023–Sep 8, 2026; selected AM ecosystem.
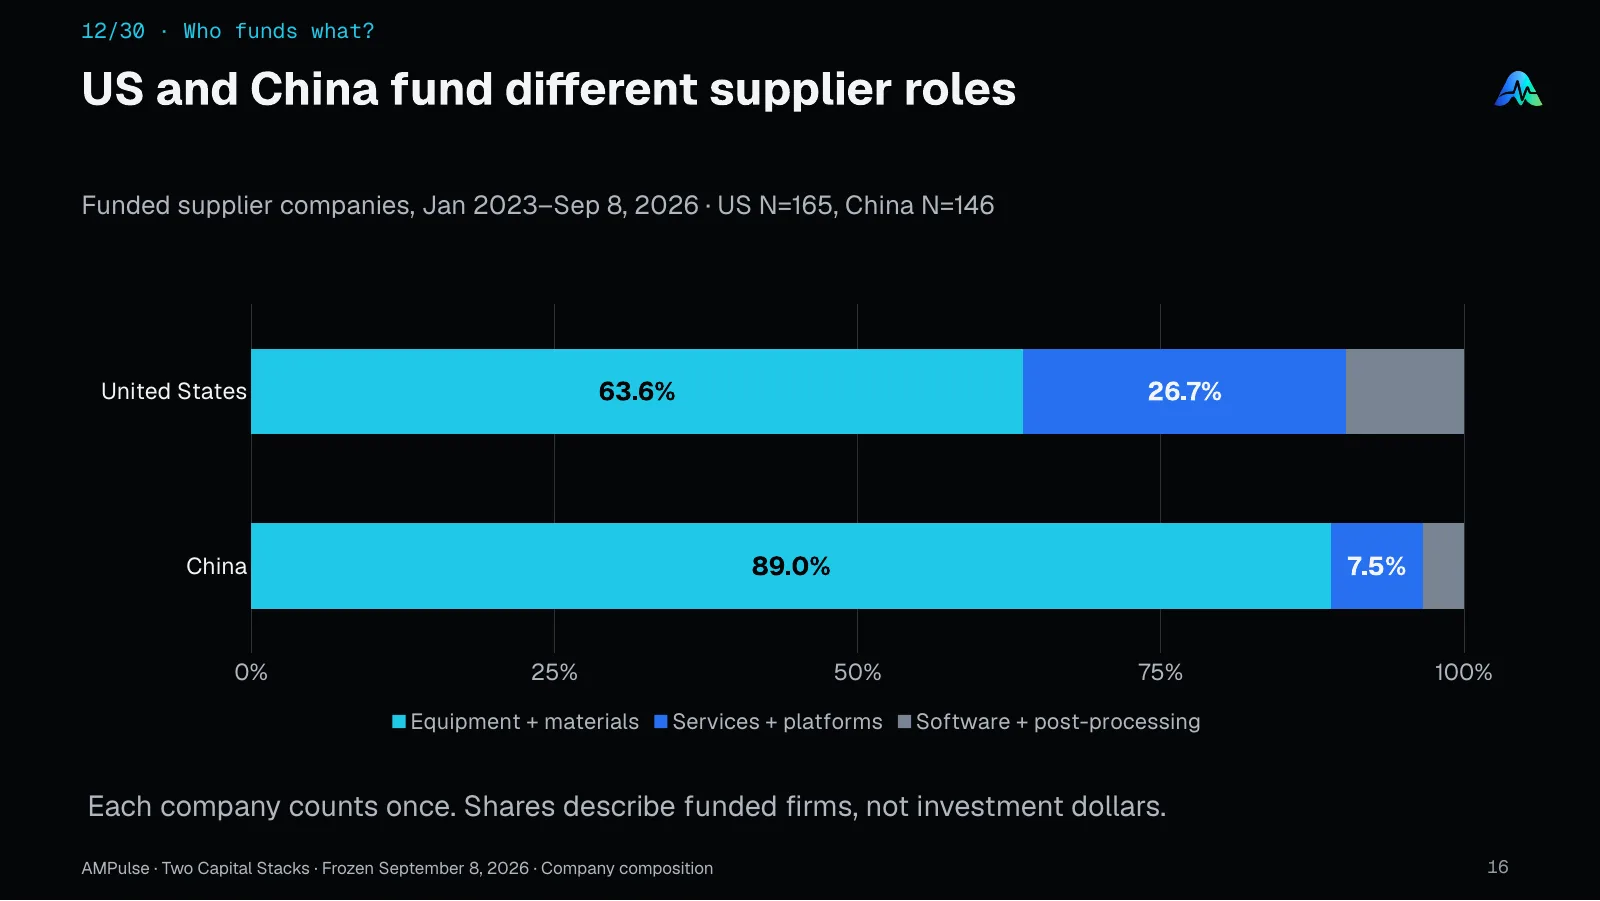
Counting each funded supplier once, 89% of funded Chinese AM suppliers make equipment or materials, against 64% in the US. Services and platforms are 27% of funded US suppliers and under 8% in China.
Source & scope
AMPulse · Two Capital Stacks · Frozen September 8, 2026 · Company composition.
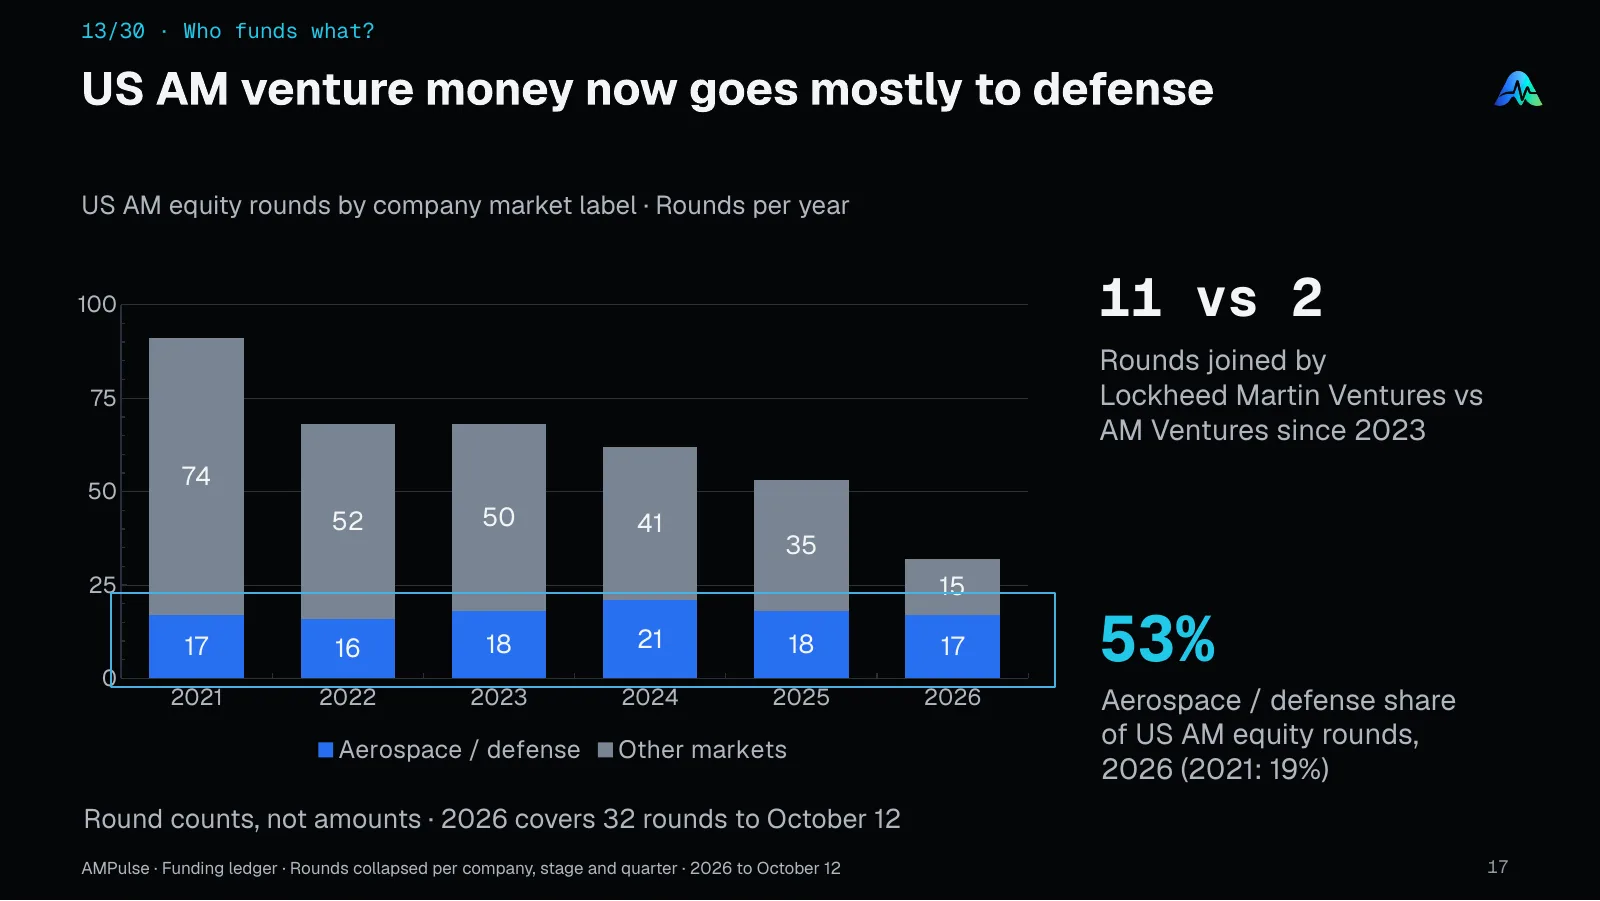
US aerospace and defense AM equity rounds held at 16 to 21 a year, while rounds in other markets fell from 74 in 2021 to 35 in 2025. In 2026 to October 12, aerospace and defense account for 53% of US AM equity rounds, against 19% in 2021. Since 2023, Lockheed Martin Ventures joined 11 rounds and AM Ventures 2.
Source & scope
AMPulse · Funding ledger · Rounds collapsed per company, stage and quarter · 2026 to October 12.
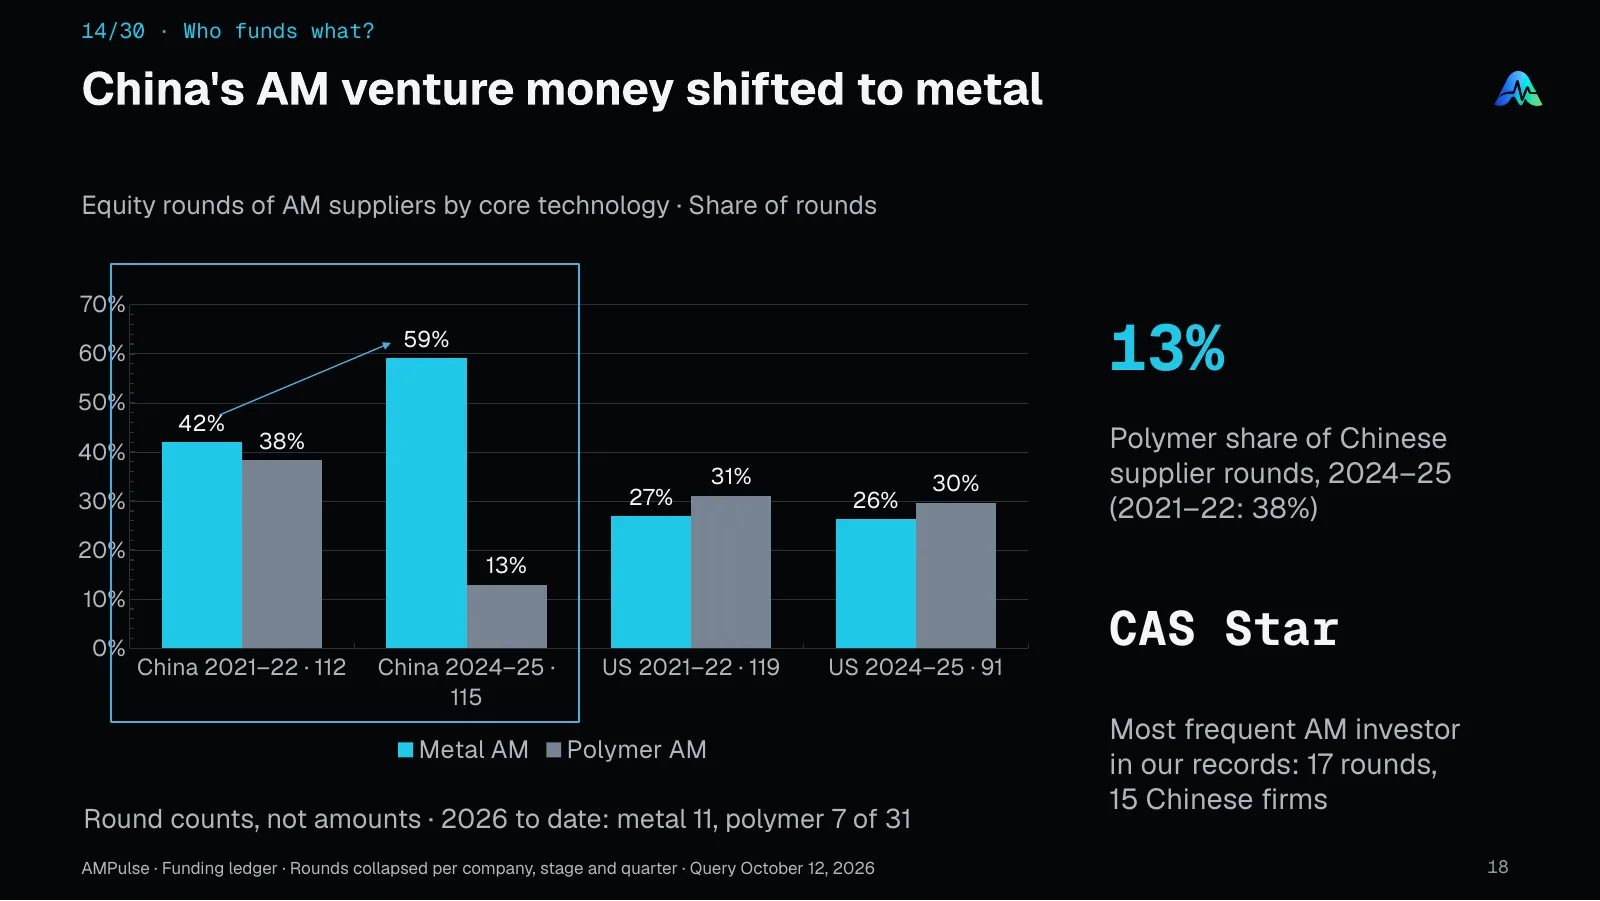
Polymer companies took 38% of Chinese AM supplier equity rounds in 2021–22 and 13% in 2024–25, while metal rose from 42% to 59%. The US mix barely moved. CAS Star is the most frequent AM investor in the ledger, with 17 rounds in 15 Chinese companies.
Source & scope
AMPulse · Funding ledger · Rounds collapsed per company, stage and quarter · Query October 12, 2026.
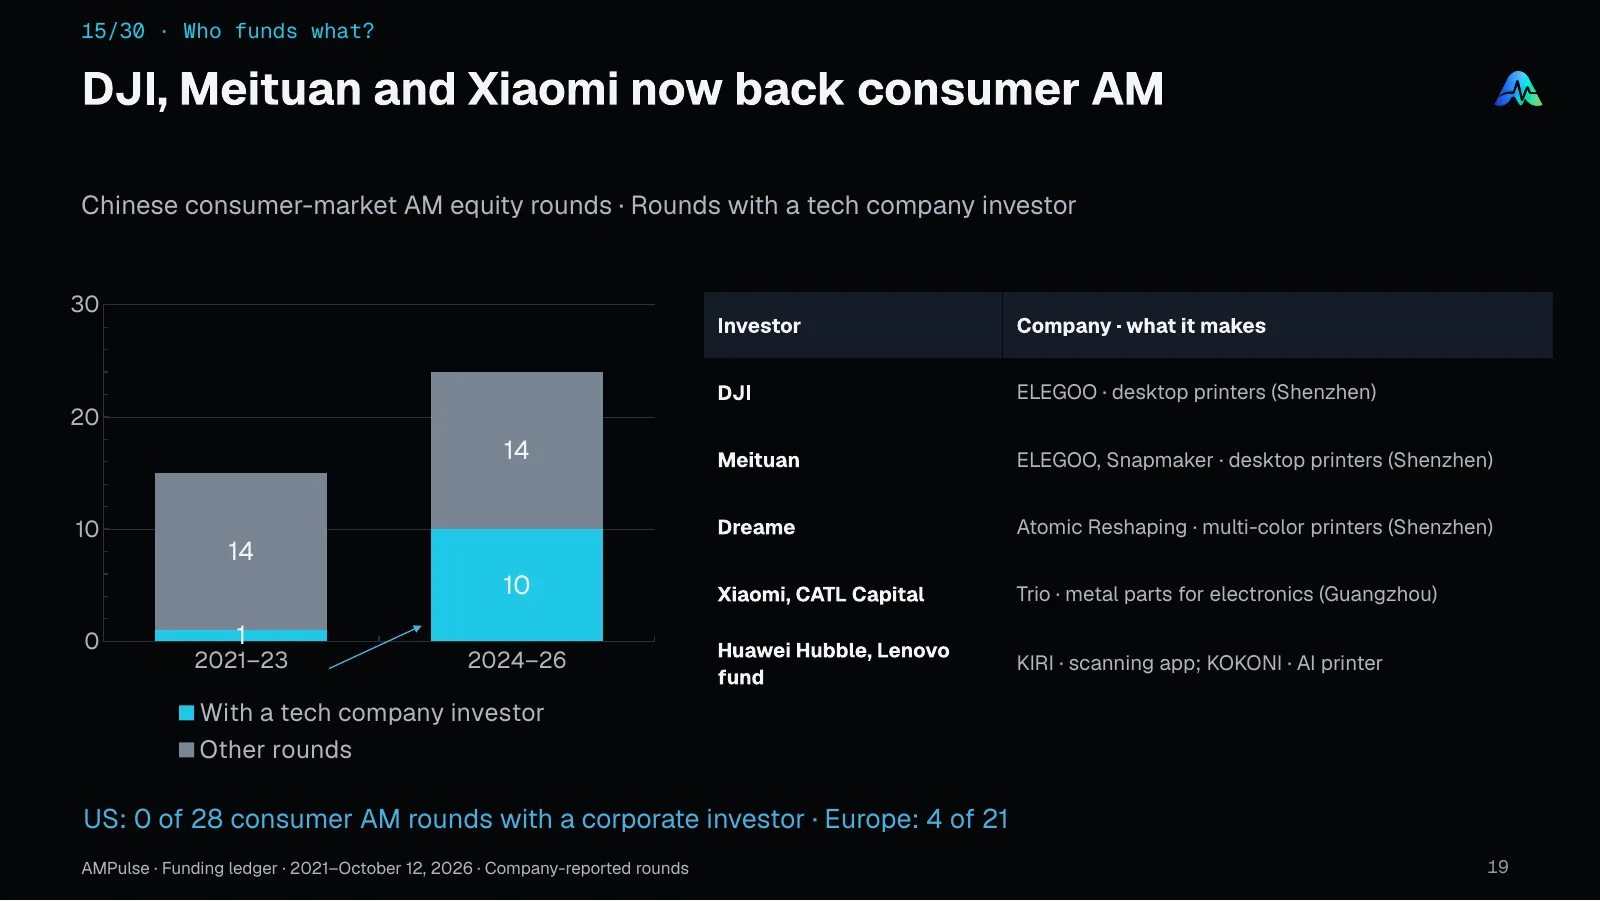
From 2021 to 2023, 1 of 15 Chinese consumer AM equity rounds included a tech company investor; since 2024, 10 of 24, including DJI and Meituan in ELEGOO, Meituan in Snapmaker, Xiaomi and CATL Capital in Trio, and Huawei's Hubble in KIRI. None of 28 US consumer AM rounds had a corporate investor.
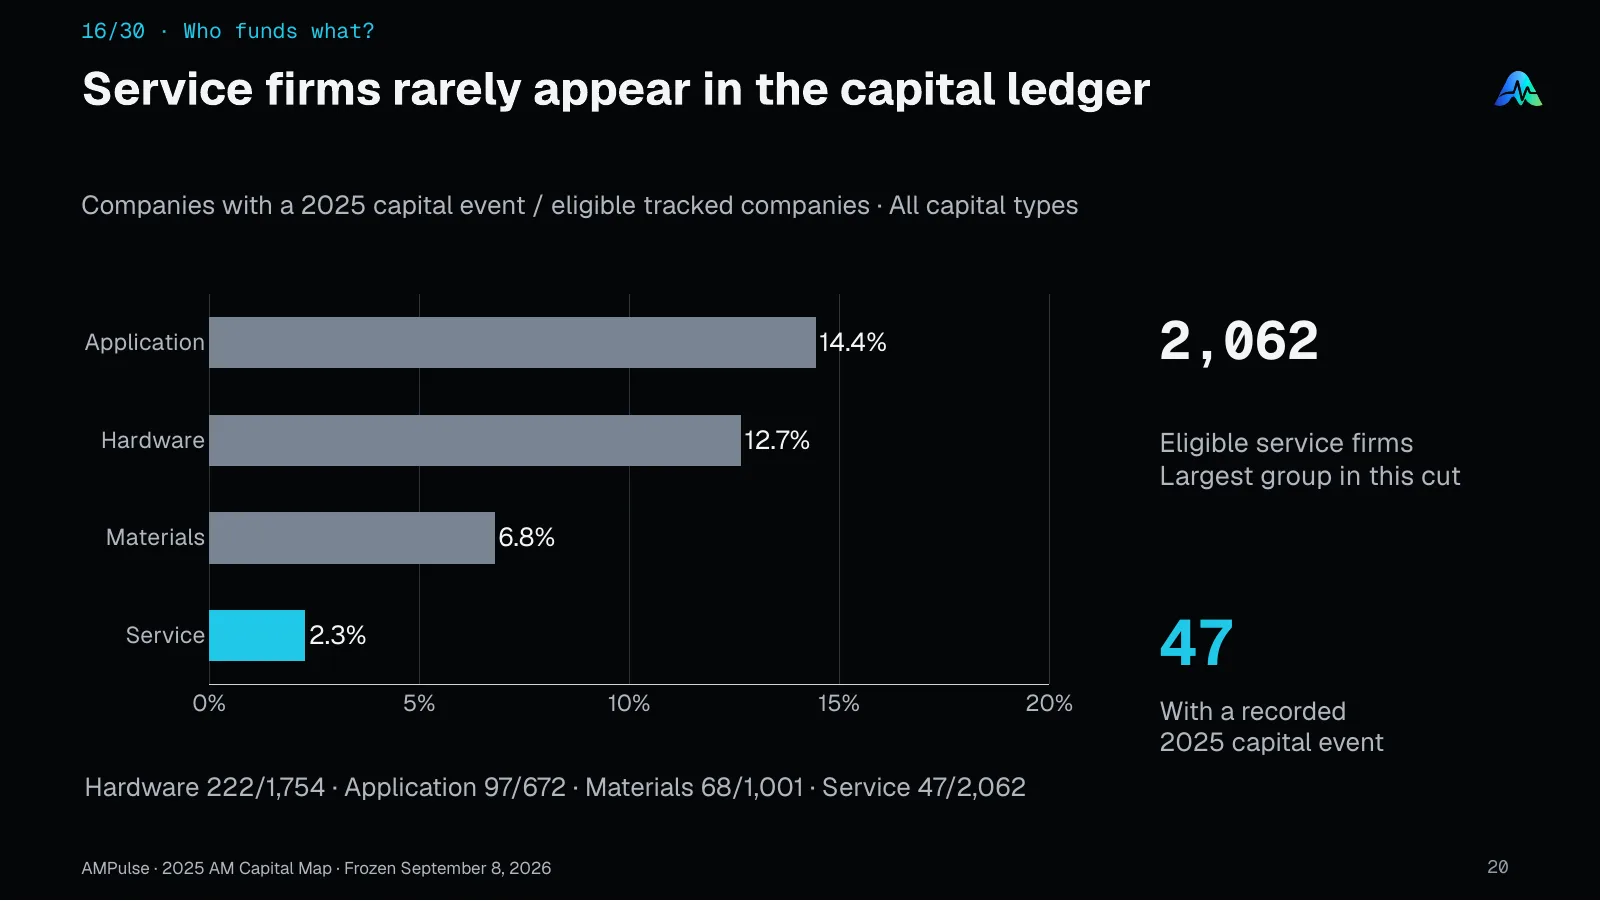
Service firms are the largest group in this cut, 2,062 eligible companies, but only 47 (2.3%) had a recorded capital event in 2025, against 12.7% of hardware companies and 14.4% of application companies.
Source & scope
AMPulse · 2025 AM Capital Map · Frozen September 8, 2026.
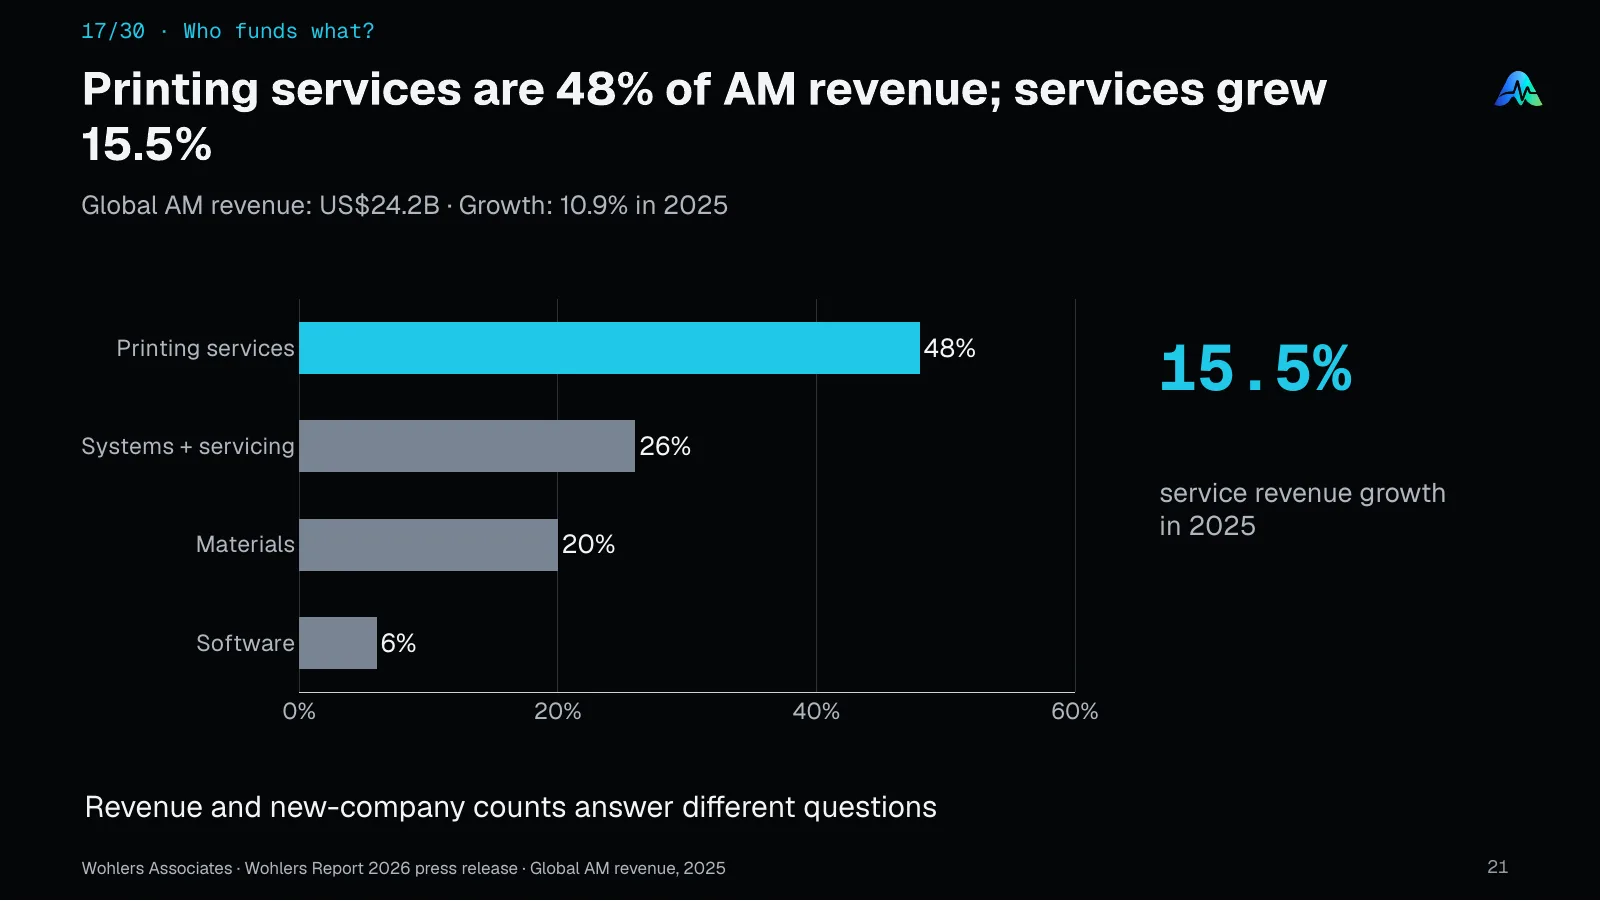
Wohlers Associates puts global AM revenue at $24.2 billion in 2025, up 10.9%, with printing services the largest segment at 48%; services revenue grew 15.5%. Read with insight 16, the largest revenue segment is the one least present in the capital ledger.
Source & scope
Wohlers Associates · Wohlers Report 2026 press release · Global AM revenue, 2025.
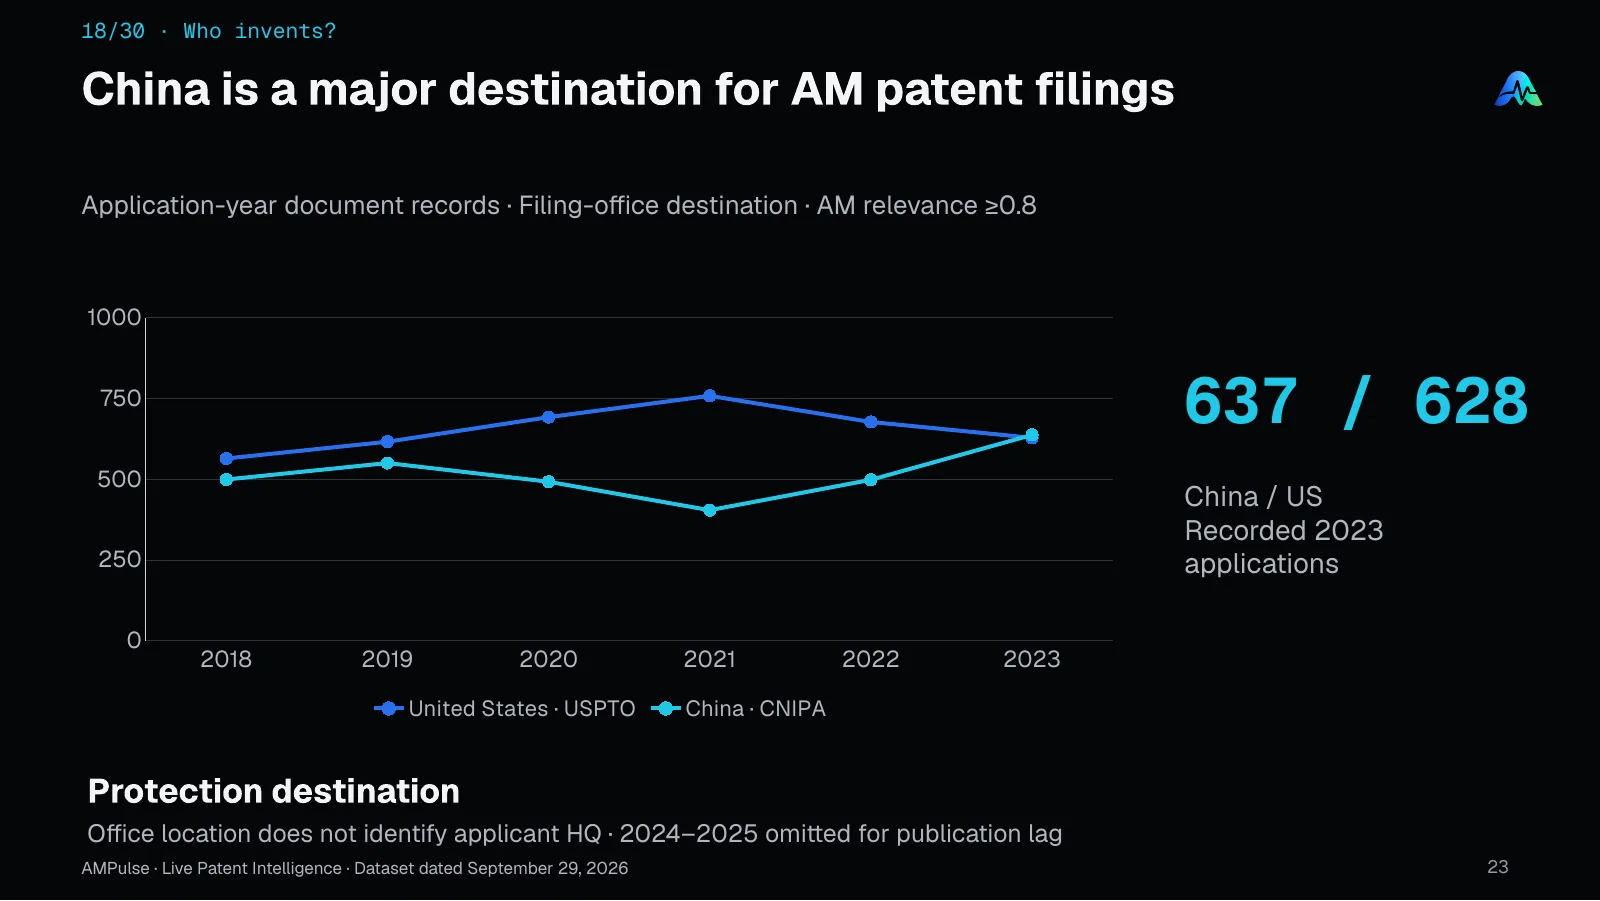
For applications filed in 2023, AMPulse records 637 AM patent applications at China's patent office and 628 at the US office; until 2022 the US office was ahead. The count is by protection destination, not applicant headquarters.
Source & scope
AMPulse · Live Patent Intelligence · Dataset dated September 29, 2026.
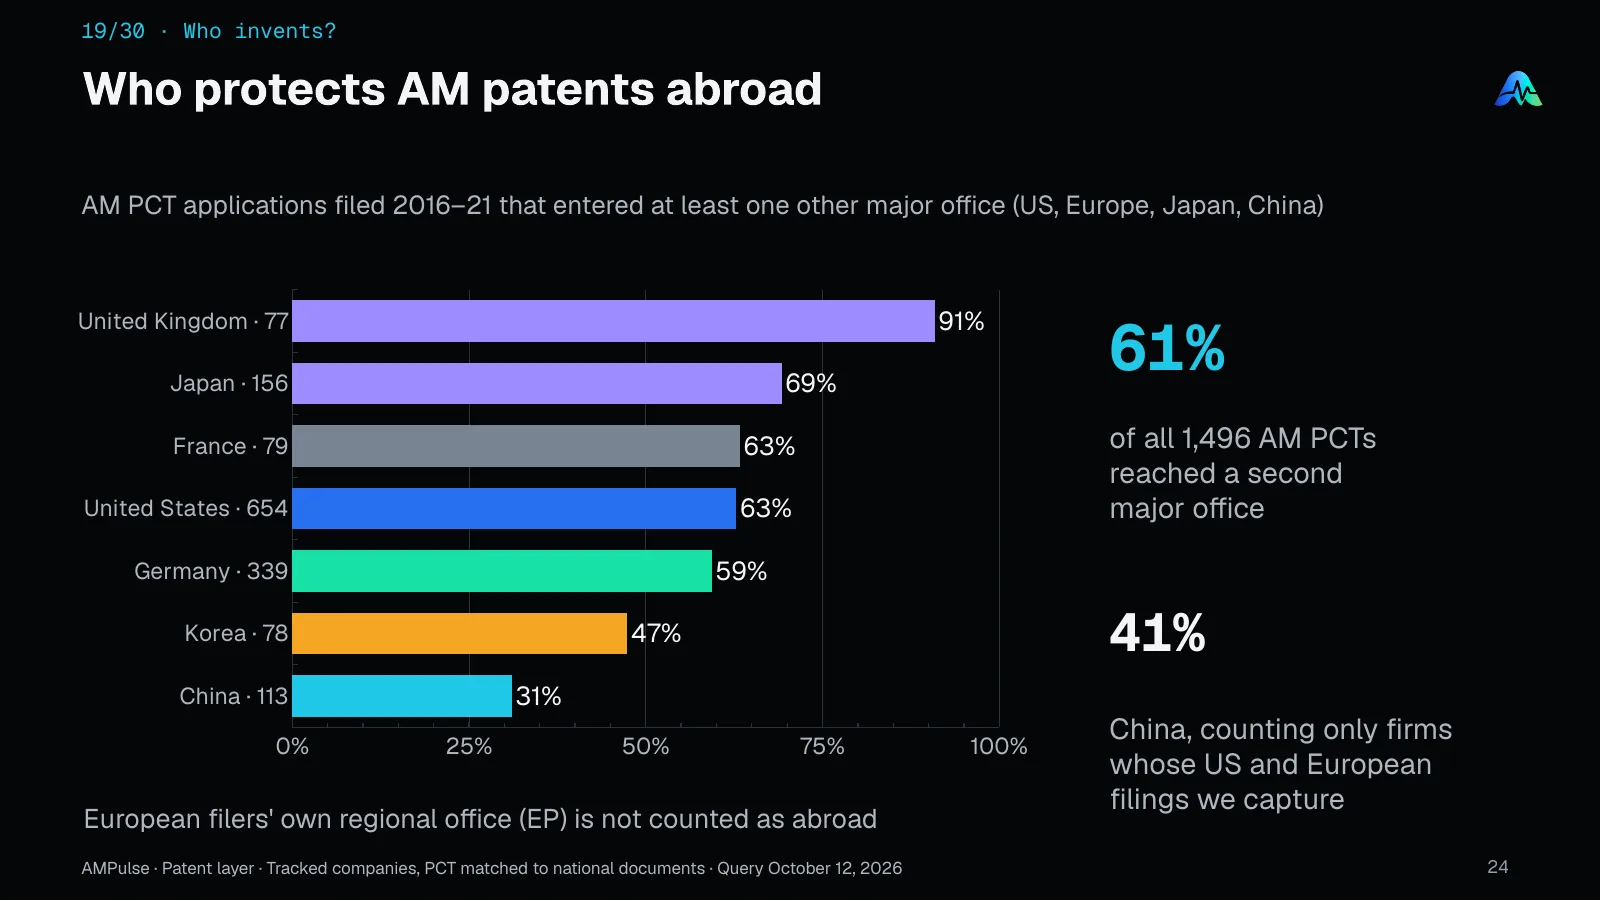
Of AM PCT applications filed in 2016–21 by tracked companies, 61% entered at least one other major office (US, Europe, Japan or China): 91% for British filers, 69% Japanese, 63% US and French, 59% German, 47% Korean and 31% Chinese, or 41% counting only Chinese firms whose US and European filings are captured.
Source & scope
AMPulse · Patent layer · Tracked companies, PCT matched to national documents · Query October 12, 2026.
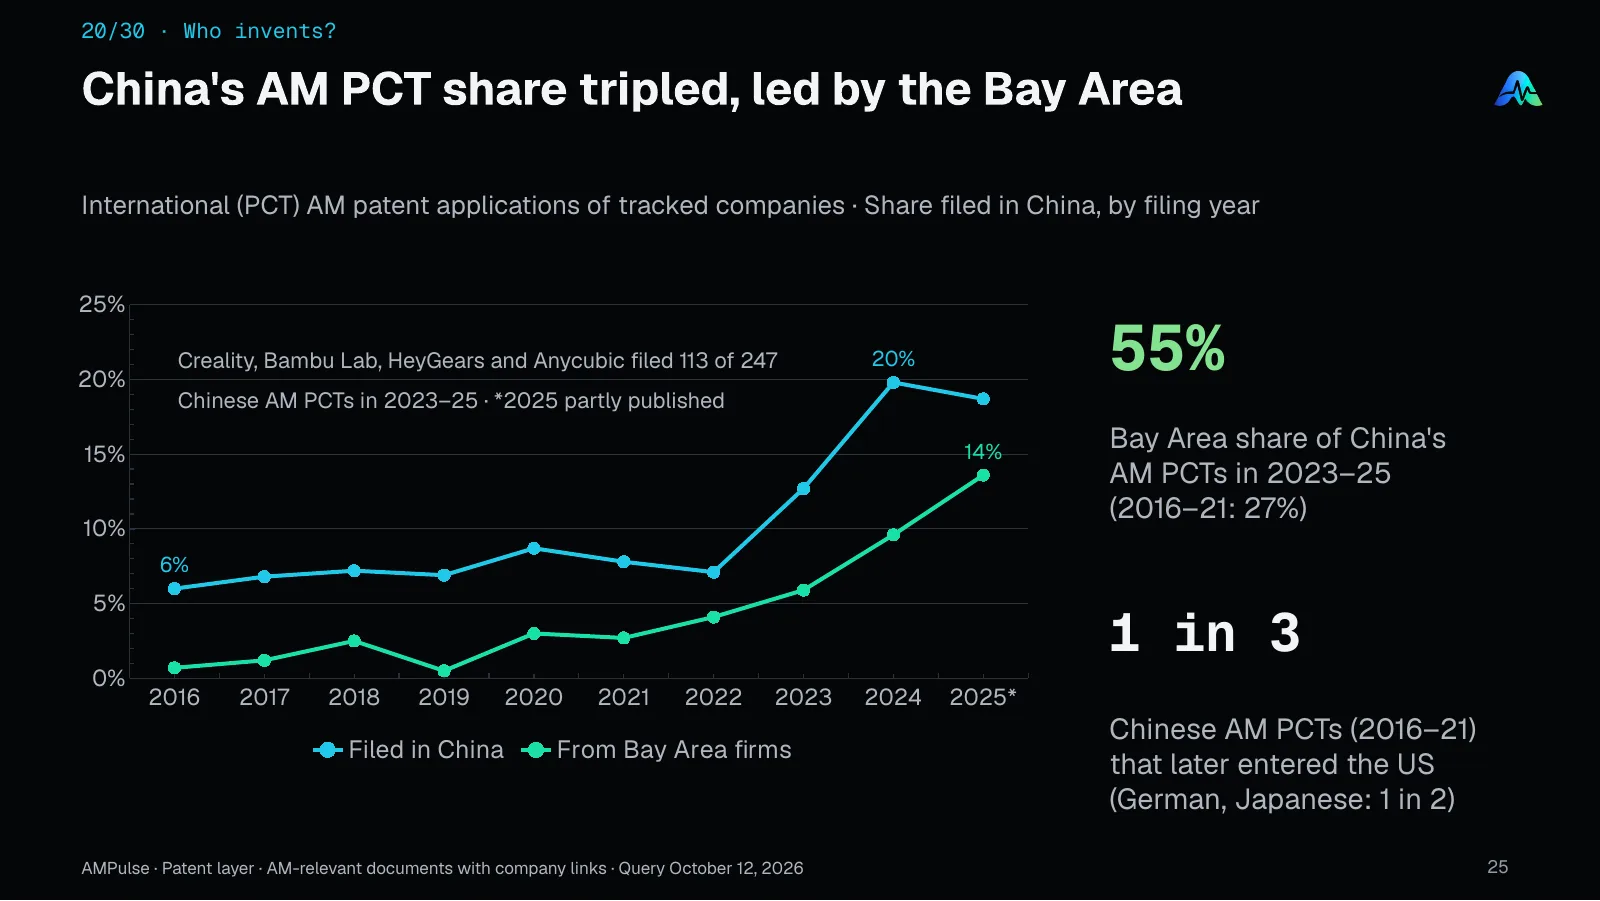
China's share of tracked companies' international AM patent applications was 6–9% through 2022 and almost 20% in 2024. Bay Area companies filed 55% of China's AM PCT applications in 2023–25, and Creality, Bambu Lab, HeyGears and Anycubic filed 113 of the 247.
Source & scope
AMPulse · Patent layer · AM-relevant documents with company links · Query October 12, 2026.
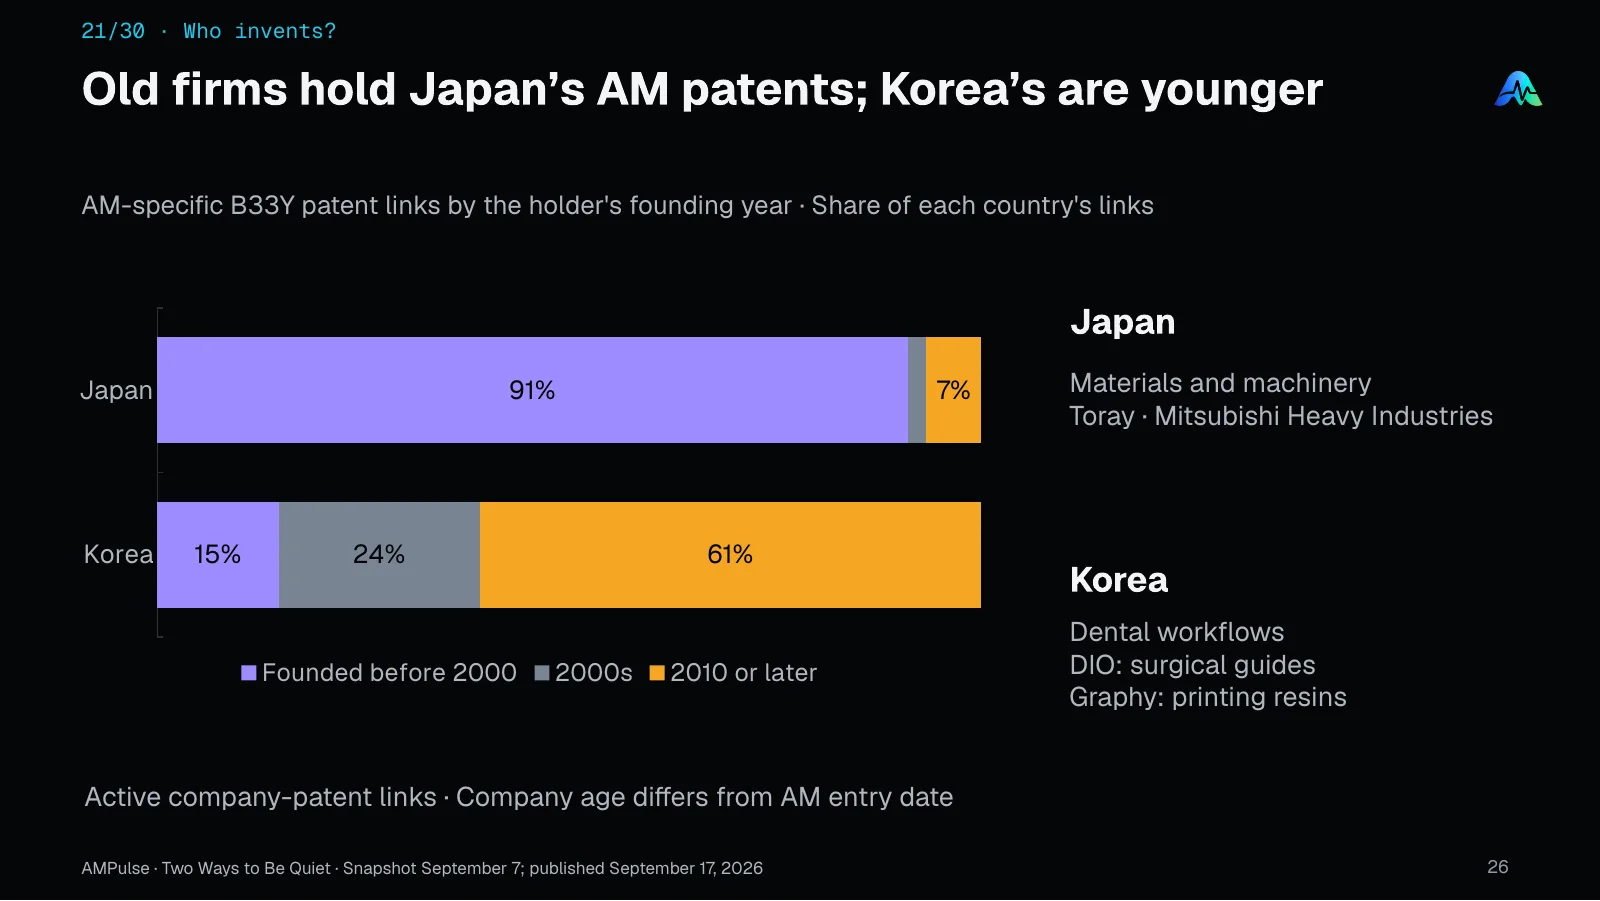
91% of Japan's AM-specific (B33Y) patent links belong to companies founded before 2000, such as Toray and Mitsubishi Heavy Industries. In Korea, 61% belong to companies founded in 2010 or later, many of them in dental workflows.
Source & scope
AMPulse · Two Ways to Be Quiet · Snapshot September 7; published September 17, 2026.
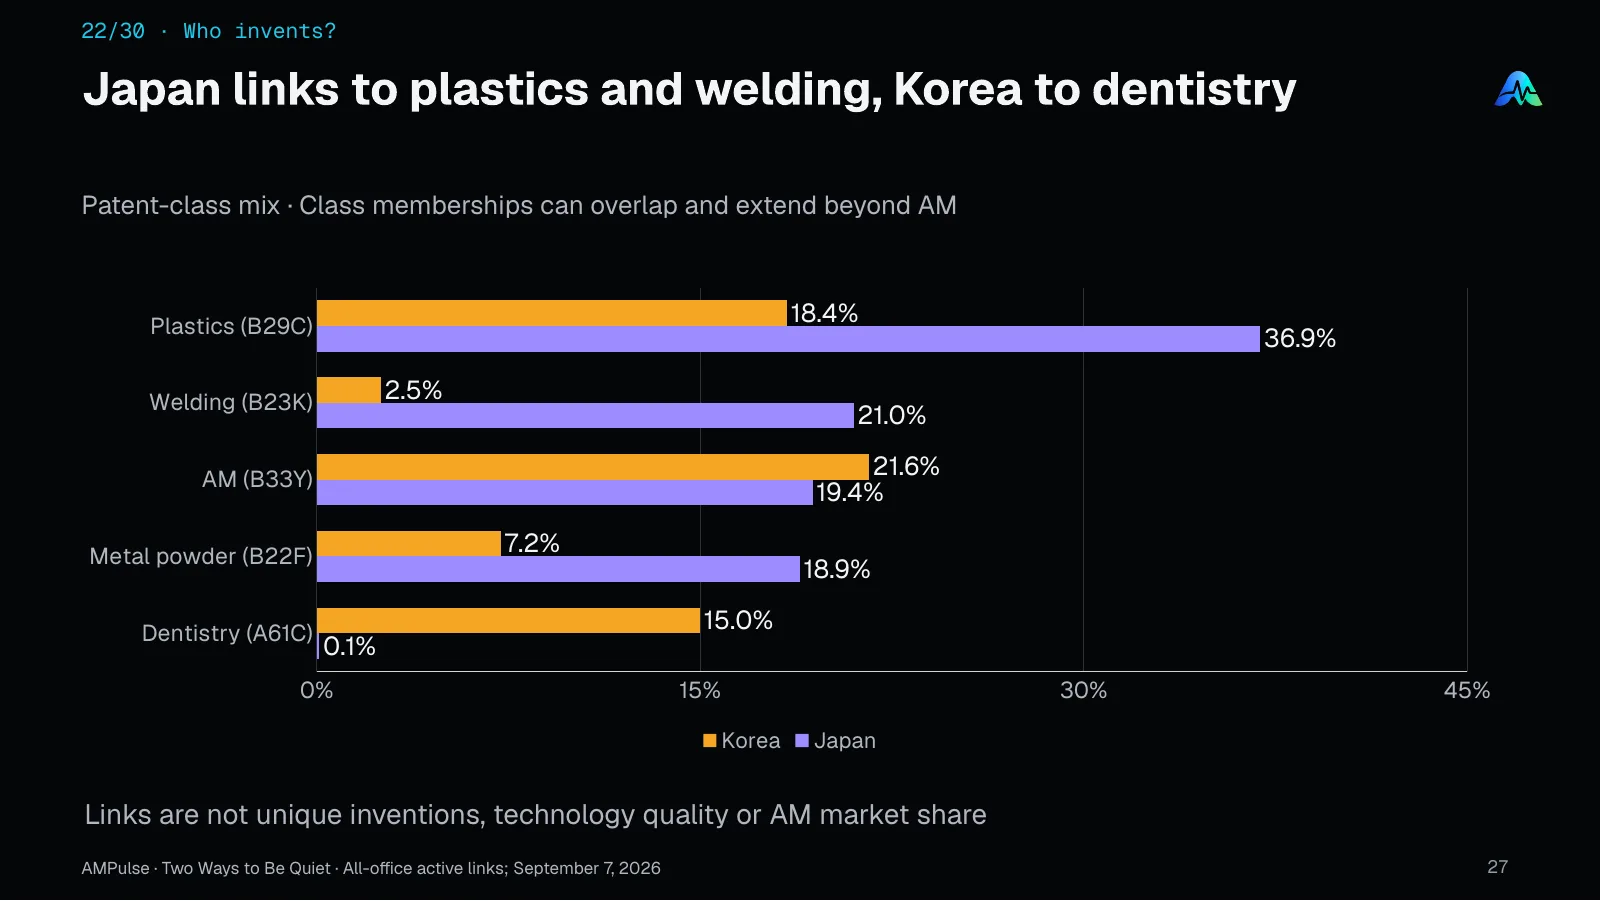
Japanese AM patent links lean to plastics processing (37%) and welding (21%). Korean links lean to dentistry (15%), against almost none in Japan. Japan brings AM into an existing manufacturing base; Korea grew it around dental and medical applications.
Source & scope
AMPulse · Two Ways to Be Quiet · All-office active links; September 7, 2026.
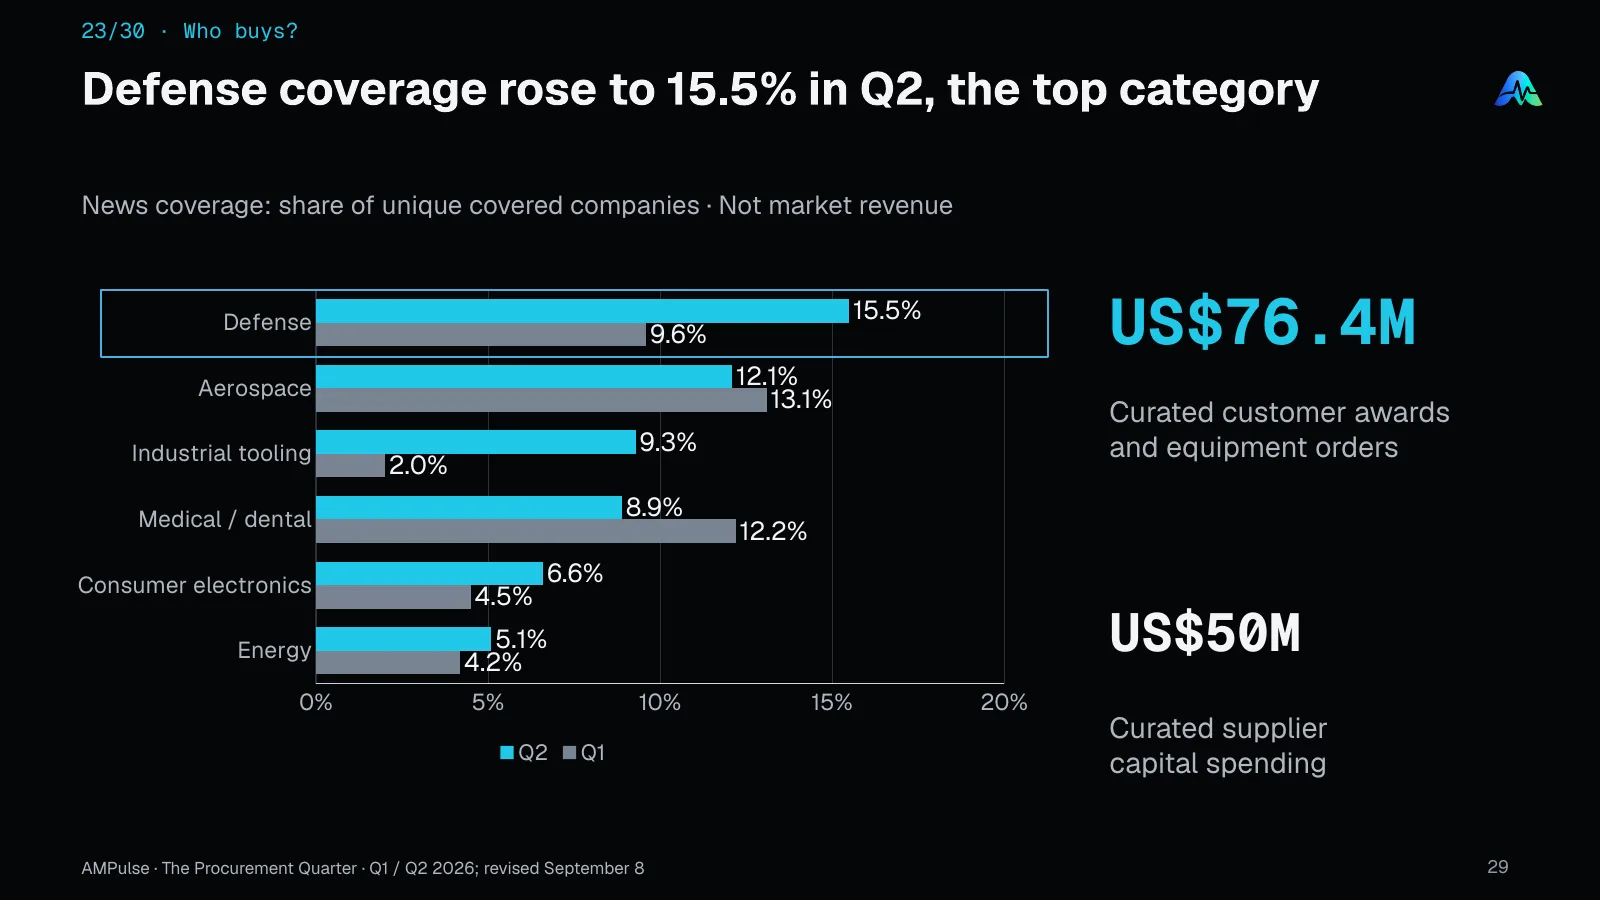
Defense became the largest end market in AMPulse news coverage in the second quarter of 2026, at 15.5% of covered companies, up from 9.6% in the first. Aerospace was 12%, and industrial tooling rose from 2% to 9%. Curated customer awards and equipment orders in the period total $76.4 million.
Source & scope
AMPulse · The Procurement Quarter · Q1 / Q2 2026; revised September 8.
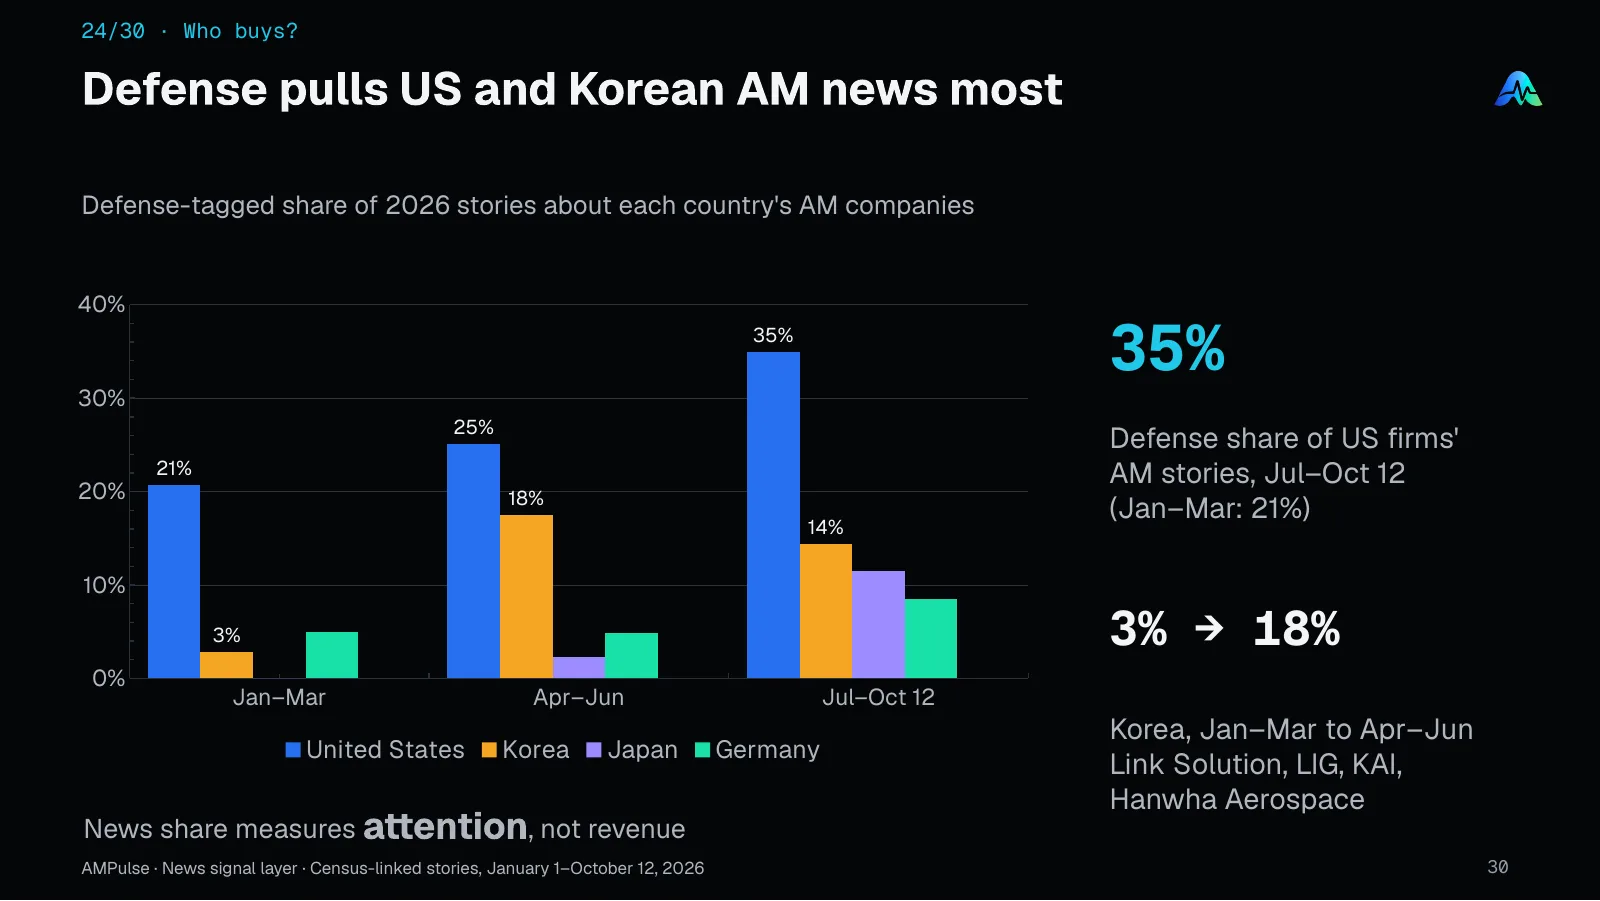
Defense-tagged stories rose from 21% of 2026 coverage of US AM companies in January to March to 35% from July to October 12. For Korean companies the share rose from 3% to 18% between the first two quarters, led by Link Solution, LIG, KAI and Hanwha Aerospace. Japan reached 11.5% in the latest period, and Germany stayed under 10%.
Source & scope
AMPulse · News signal layer · Census-linked stories, January 1–October 12, 2026.
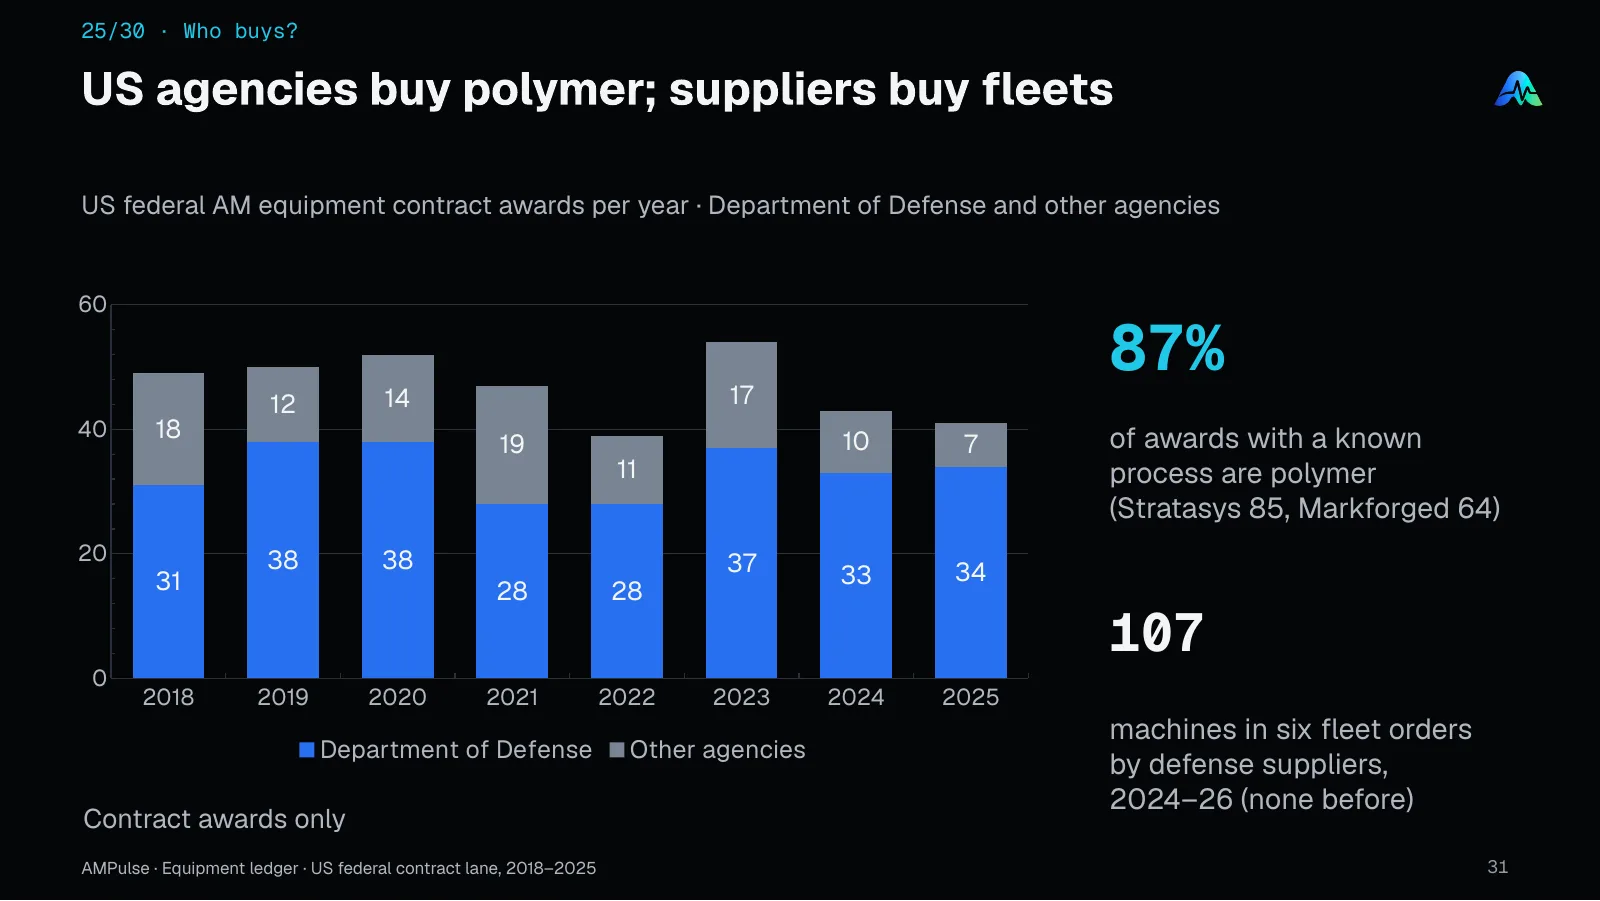
US federal AM equipment contract awards ran at 39 to 54 a year from 2018 to 2025, and 87% of those with a known process were polymer printers (Stratasys 85, Markforged 64). Fleet orders came from defense suppliers instead: none of 10 or more machines before 2024, then six orders totaling 107 machines in 2024–26.
Source & scope
AMPulse · Equipment ledger · US federal contract lane, 2018–2025.
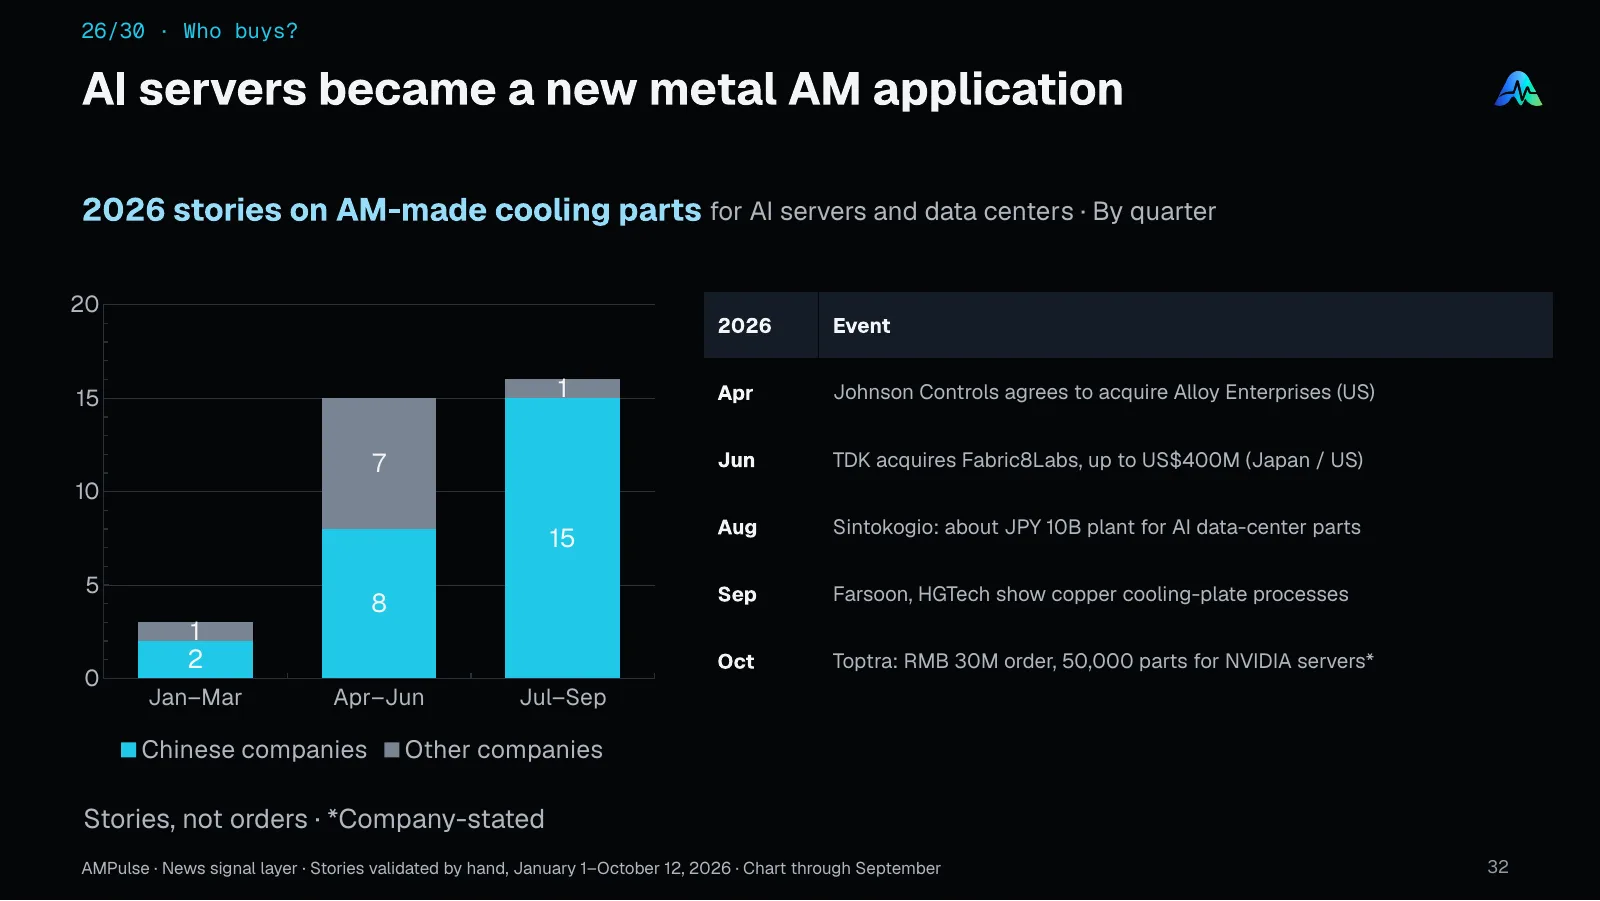
Hand-validated 2026 stories on AM cooling parts for AI servers and data centers rose from 3 in the first quarter to 16 in the third, 15 of them about Chinese companies. Events include TDK's acquisition of Fabric8Labs for up to $400 million, Sintokogio's planned plant of about JPY 10 billion and Toptra's company-stated RMB 30 million order for 50,000 parts for NVIDIA servers.
Source & scope
AMPulse · News signal layer · Stories validated by hand, January 1–October 12, 2026 · Chart through September.
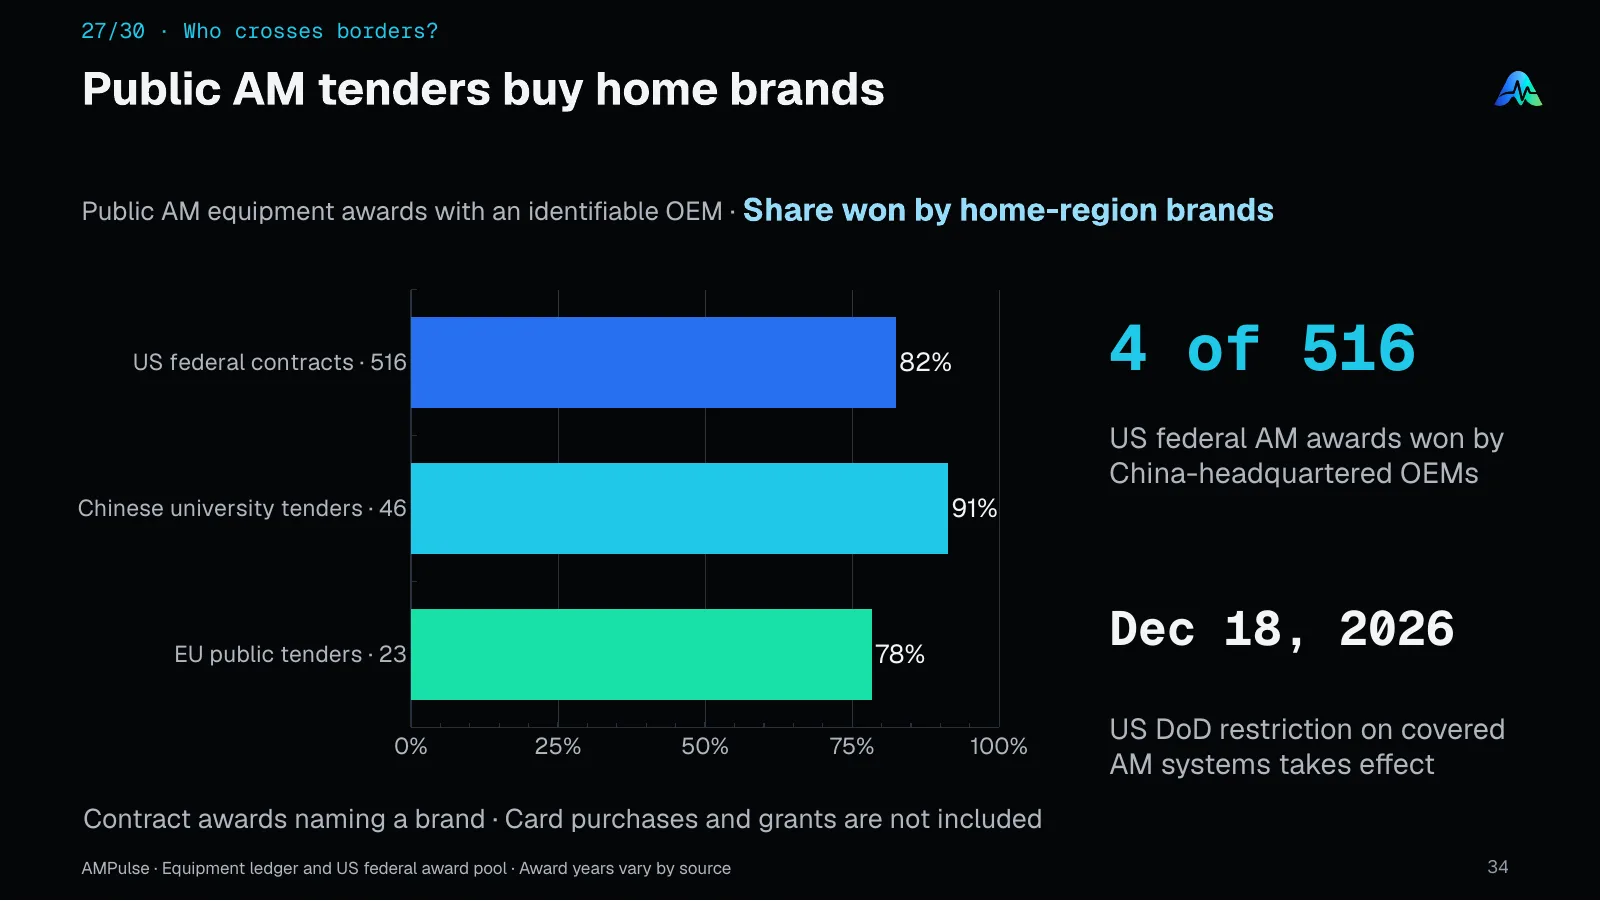
Home-region manufacturers won 82% of US federal AM equipment awards naming a brand, 91% of Chinese university tenders and 78% of EU public tenders. China-headquartered OEMs won 4 of 516 US federal awards, ahead of a US Department of Defense restriction on covered AM systems that takes effect on December 18, 2026.
Source & scope
AMPulse · Equipment ledger and US federal award pool · Award years vary by source.
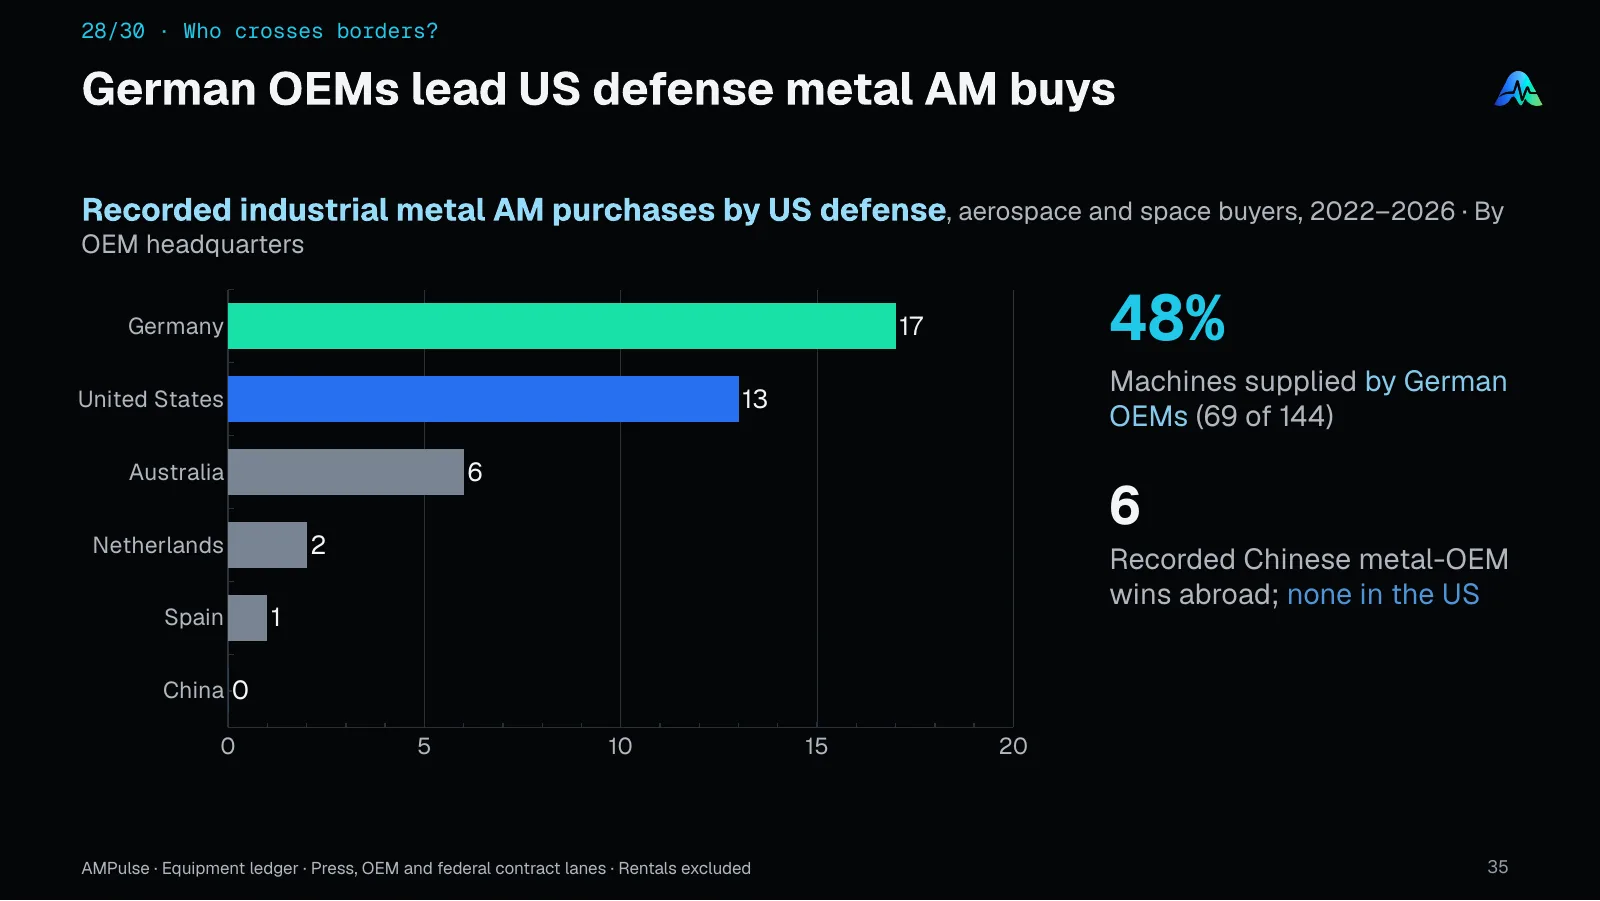
In recorded metal AM purchases by US defense, aerospace and space buyers from 2022 to 2026, German OEMs lead with 17 of 39 purchases and 48% of the machines (69 of 144), mostly EOS and Nikon SLM; Australian makers have 6. Chinese metal OEMs have 6 recorded wins abroad and none in the US.
Source & scope
AMPulse · Equipment ledger · Press, OEM and federal contract lanes · Rentals excluded.
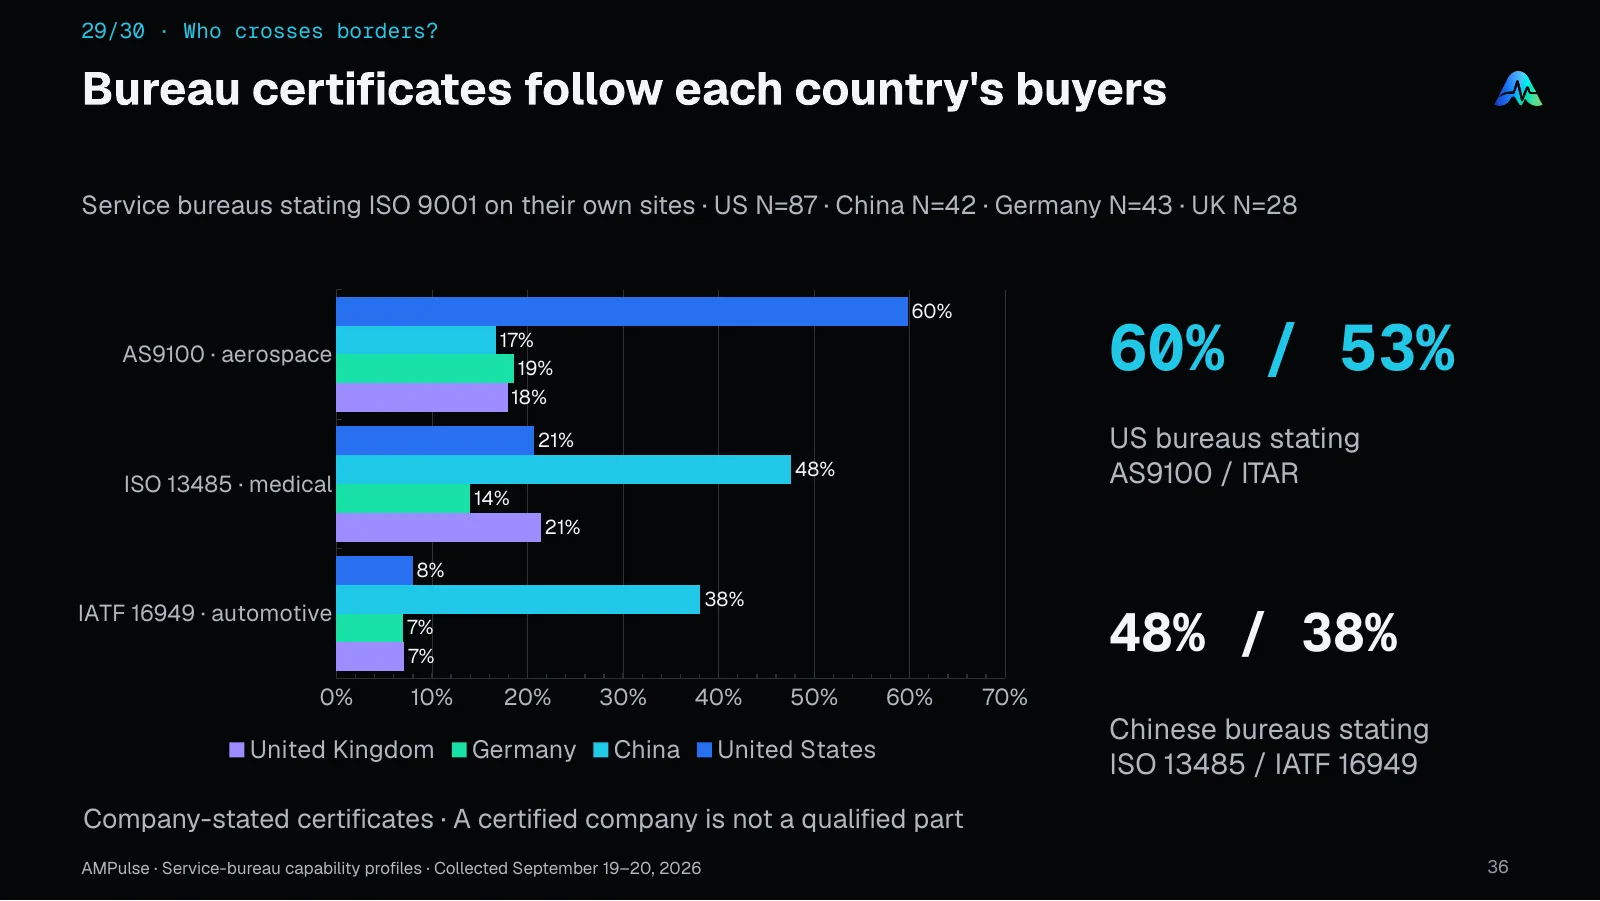
Among service bureaus that state ISO 9001 on their own sites, 60% of US bureaus also state AS9100 for aerospace and 53% ITAR. Chinese bureaus lean to ISO 13485 for medical (48%) and IATF 16949 for automotive (38%).
Source & scope
AMPulse · Service-bureau capability profiles · Collected September 19–20, 2026.
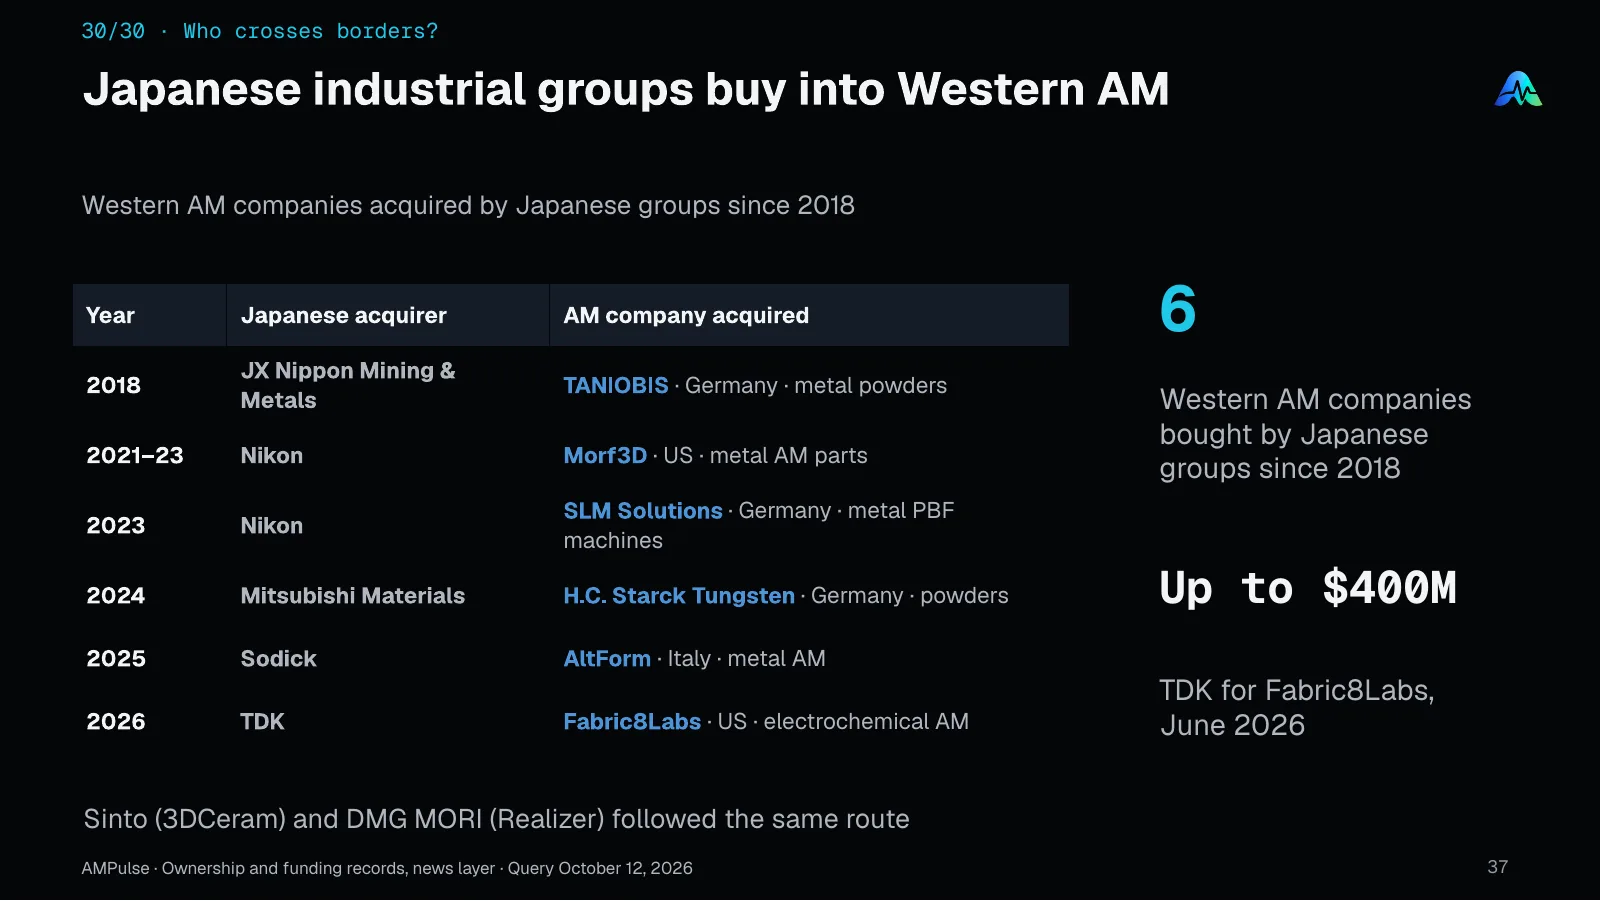
Since 2018, Japanese industrial groups have acquired six Western AM companies: TANIOBIS (JX Nippon Mining & Metals), Morf3D and SLM Solutions (Nikon), H.C. Starck Tungsten (Mitsubishi Materials), AltForm (Sodick) and Fabric8Labs (TDK, up to $400 million, June 2026). The targets are powders, machines and new processes.
Source & scope
AMPulse · Ownership and funding records, news layer · Query October 12, 2026.
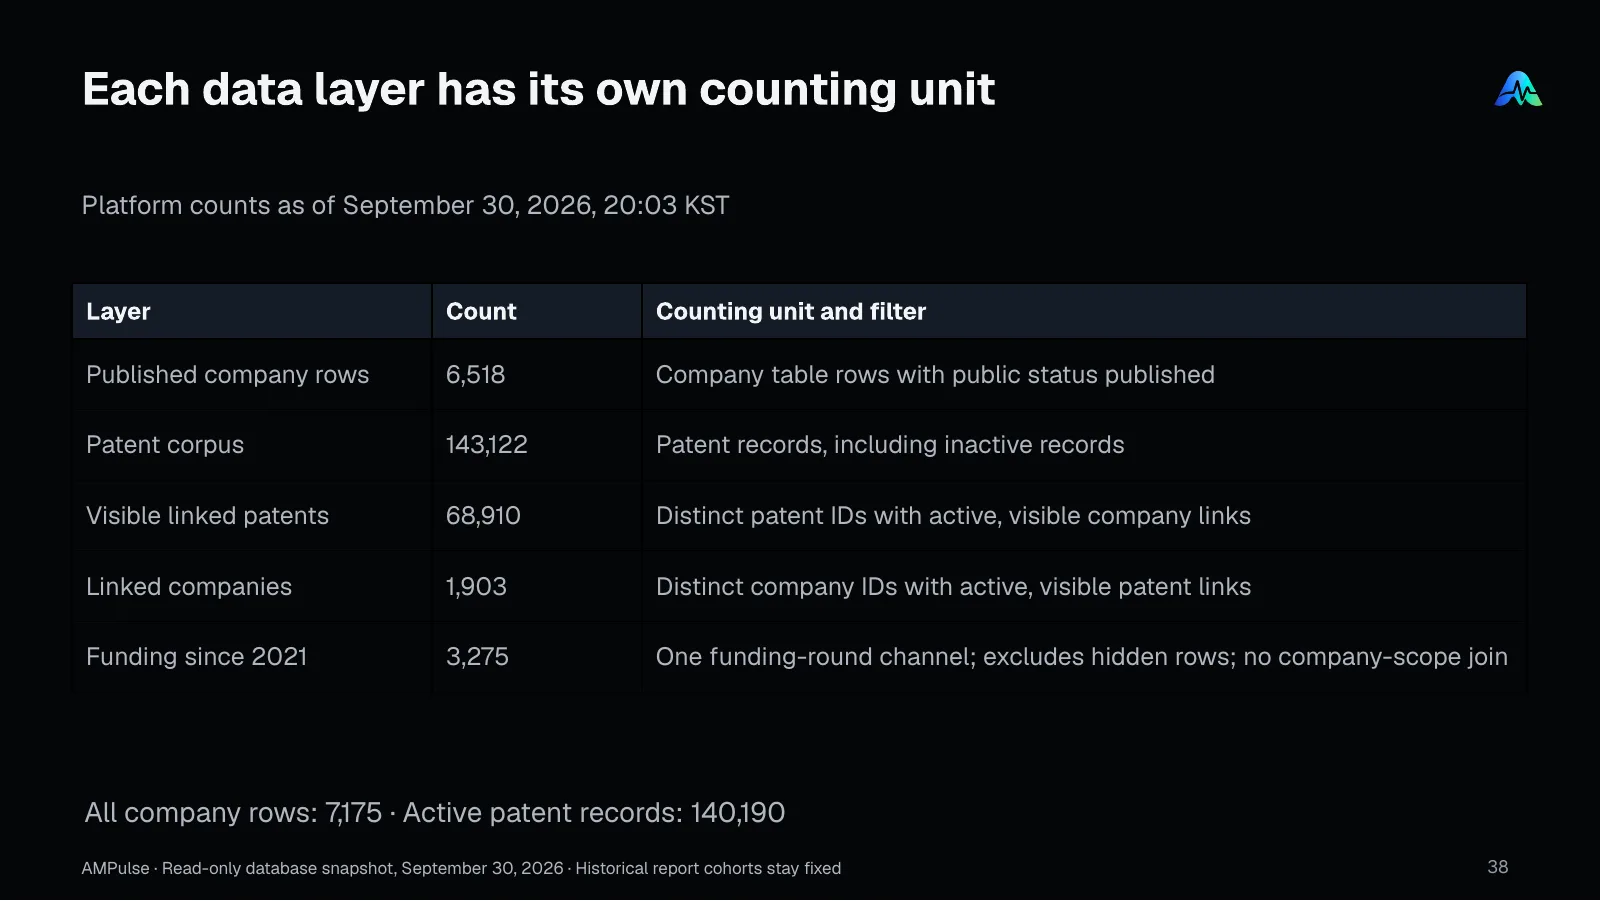
AMPulse's connected dataset includes about 6,500 published company profiles, more than 140,000 patent records, about 69,000 patents linked to 1,900 companies, and more than 3,000 funding records since 2021. The revenue figures in finding 17 come from the Wohlers Associates press release.
Each finding identifies its source, counting unit and snapshot. Company counts, funding events, patents, news stories and equipment purchases describe different parts of the industry; they are not interchangeable measures of market size.